

Gold traders are currently faced with an interesting event. Without any major announcement and in a discreet way, stocks of gold held at Comex warehouses dropped by the largest figure ever on record during a single quarter since eligible record keeping began in 2001 (more or less the start of the gold bull market).
Approximately two million ounces of gold have been drained from the physical inventories, with no clear reason as to why and who is behind this scenario. Should there be a continuation in this tendency; the price of this commodity will definitely be impacted.
TECHNICALY SPEAKING
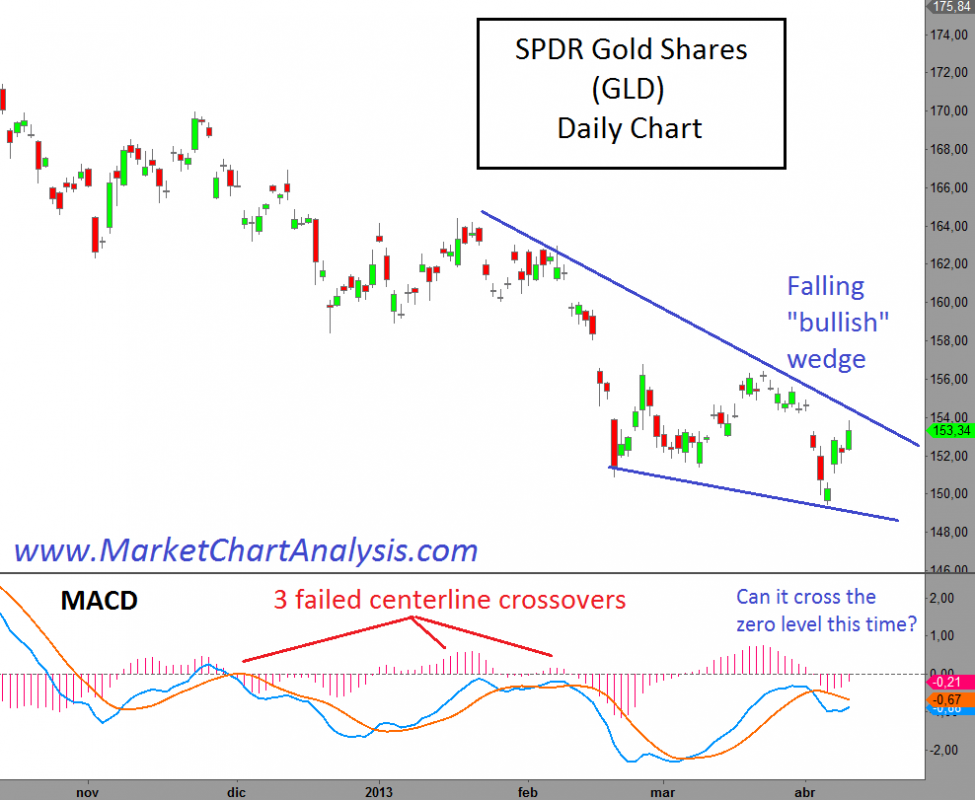
On the daily chart of SPDR Gold Shares ETF (GLD) there is a falling wedge with bullish implications. However, traders must be careful that previous rallies have failed. This can be seen on the MACD indicator which has not been able to perform a centerline crossover as yet.
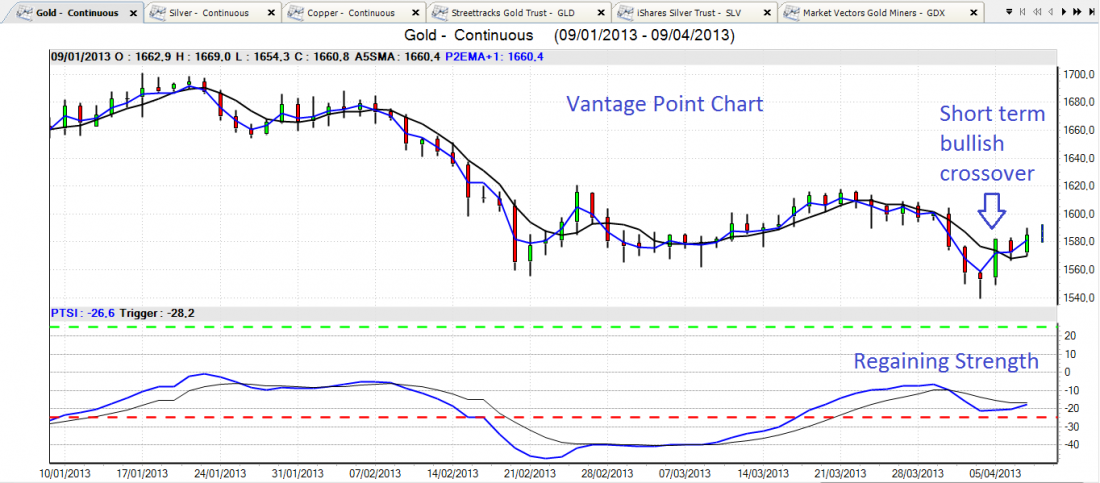
On the Vantage Point Chart, the short term crossover has already given a possible buy signal. But this is pending confirmation from other indicators like the TSI, which is starting to show new underlying strength in the yellow metal.
BOTTOM LINE
Although paper gold might give us another chance to enjoy a good rally with an upcoming spike in the price of GLD, traders should periodically monitor physical stocks in Comex.
In the meantime, follow the MACD indicator as a signal crossover might be on its way and should there be a follow up centerline crossover, the chances for a large rally are much higher.

