

Prior to last week’s detour to discuss the gold market my April commentaries have been about Lindsay’s long cycle and how that matches what we all normally think of as secular bull and bear markets in U.S. equities.
The second commentary in this series discussed finding the high in the current long cycle and the conclusion was that a high should be found between March and September of this year. Before going any further with Lindsay I want to spend this week to see if we can confirm this forecast using another common cycle approach (non-Lindsay), the four-year cycle.
HOW IT WORKS
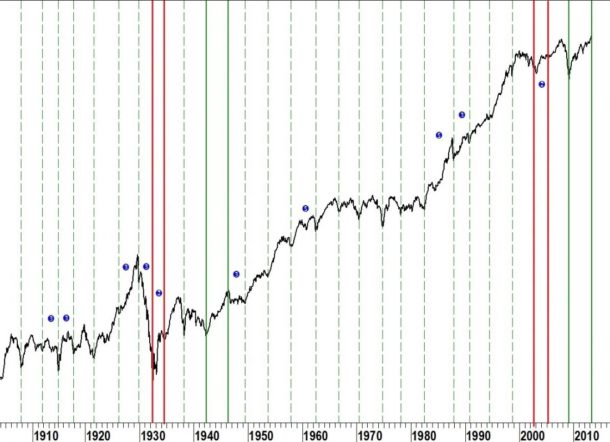
The vertical lines on the historical chart of the Dow Industrial Average (below) represent the four year cycle. There are a few cycles which contract closer to three years and two which expand to five years but the overwhelming majority of cycles are four year cycles.
There have been only two times in over 100 years that the cycle has contracted to two years and those are highlighted with red vertical lines. The final low in each two-year cycle is, coincidentally, a time when Lindsay’s long cycle was experiencing a shift as well.
KEY AREAS
The solid green lines are the focus of this week’s commentary. Notice that in these two instances the cycles have inverted.
That is, instead of a cycle which extends from low to low, these cycles extend from a low to a high. What could have caused this inversion? During WWII the Fed became heavily involved in buying treasury bills for the first time. By 1946 the Fed had bought virtually every T-bill in existence in order to help keep interest rates low for the war effort.
We all know of the Fed’s recent efforts (QE to Infinity!) to jump start the economy by buying Treasury debt. The final green vertical line on the chart shows that it has been four years since the last four year low and we are currently at a high.
BOTTOM LINE
It is another sign that the market has reached a top.

