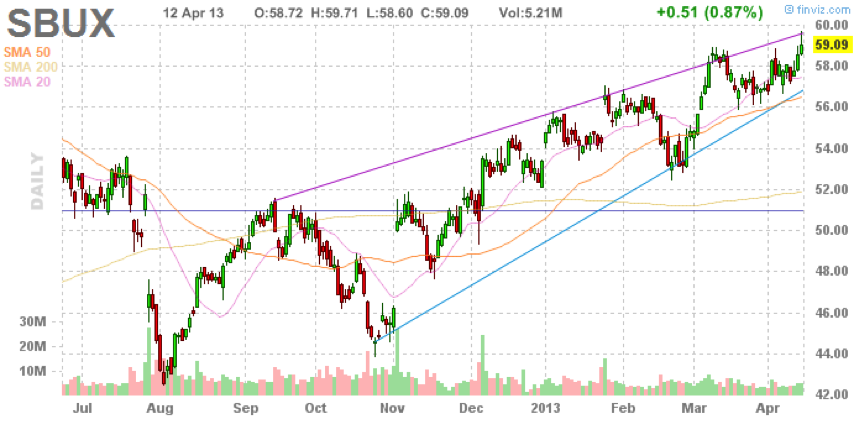
Starbucks Corporation (SBUX), which has been trading in the range of $54.00 – $59.71 over the past 30 days, is seeing very strong technical and fundamental characteristics that make it a buying opportunity.
Technical indicators include a bullish MACD crossover signal, with support around $57.80 and resistance in the $59.20 range, and the stock is trading above both the 50-day moving average and above the 200-day moving average.
A LOOK AT FUNDAMENTALS
SBUX’s bullish technical indicators are supported by strong fundamentals, as well. First quarter earnings showed strong domestic performance and growth of its packaged product segment. Net revenues jumped 11%, while net income climbed 13%. Same-store sales were up 6% on a consolidated basis, while sales in the Americas (dominated by the U.S.) rose 7%. Consolidated operating margin rose 40 basis points to 16.6%.
SBUX PE stands at 31.79, at the industry average, and above the S&P 500 average of 16.70. SBUX’s current Price/Sales of 3.21 is at the average of its industry of 3.24. The beta of 0.78 implies lower volatility of the stock with respect to the S&P 500. SBUX’s Total Debt/Equity is 10.62 and is acceptable for our model. The company pays dividend with 1.30% dividend yield. The company expects earnings of $2.06 per share to $2.15 per share, representing growth of 15 to 20% from 2012.