

Small-cap stocks generally make up about 40-50% of the stocks traded in most major equity markets (mid-caps 30-40%, large-caps 10-15%).
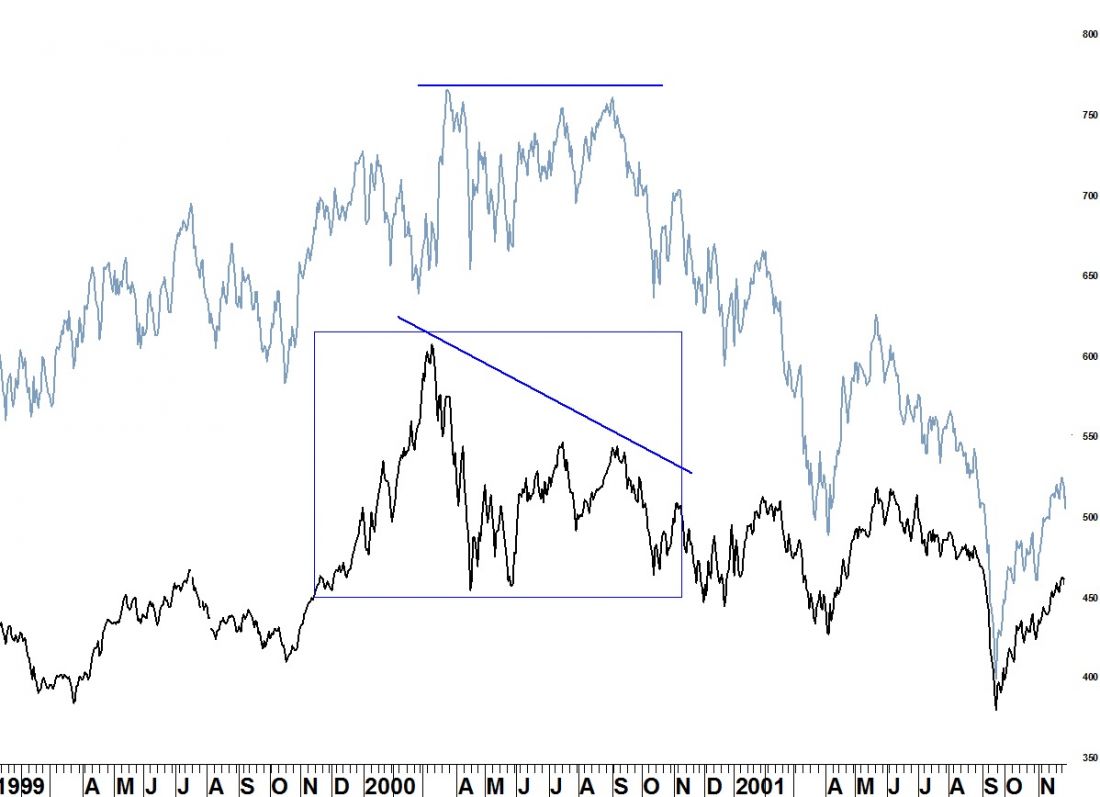
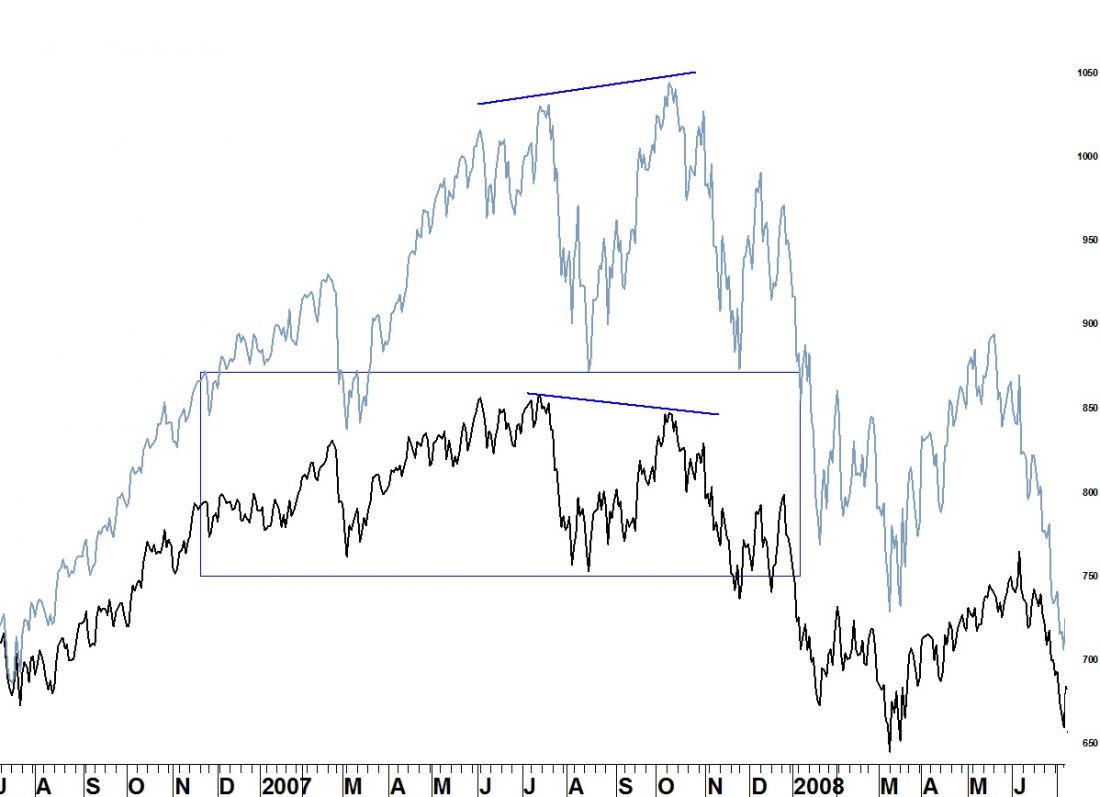
As a bull market nears its end through a series of higher highs in the large-cap indices (DJIA, S&P 500), investors will see a growing majority of stocks already in downtrends. The two charts below show how small cap stocks failed to make new highs with the S&P 500 and formed their own distribution tops at the bull market highs in 2000 and 2007.
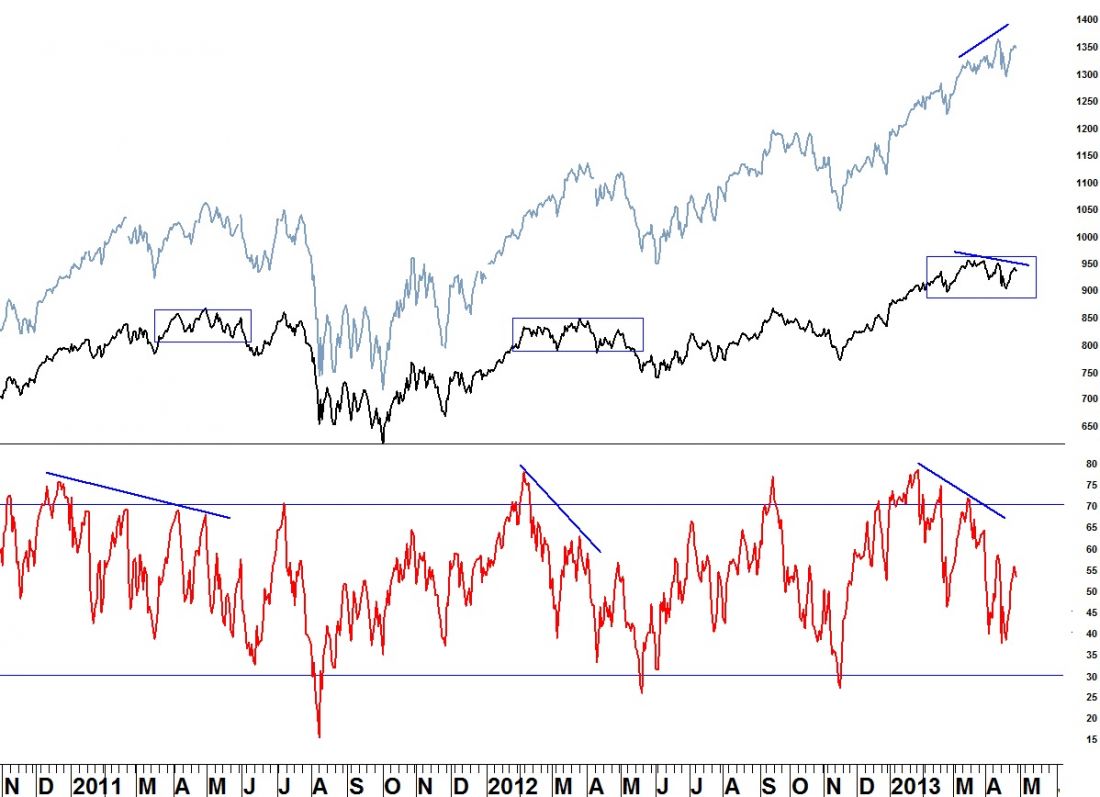
The Russell 2000 (RUT) is now forming a distribution top similar to past highs in the index in 2011 and 2012 (as well as 2000 and 2007). Additionally, the most recent high in March was accompanied by a negative divergence in RSI (just as the 2011 and 2012 tops were).
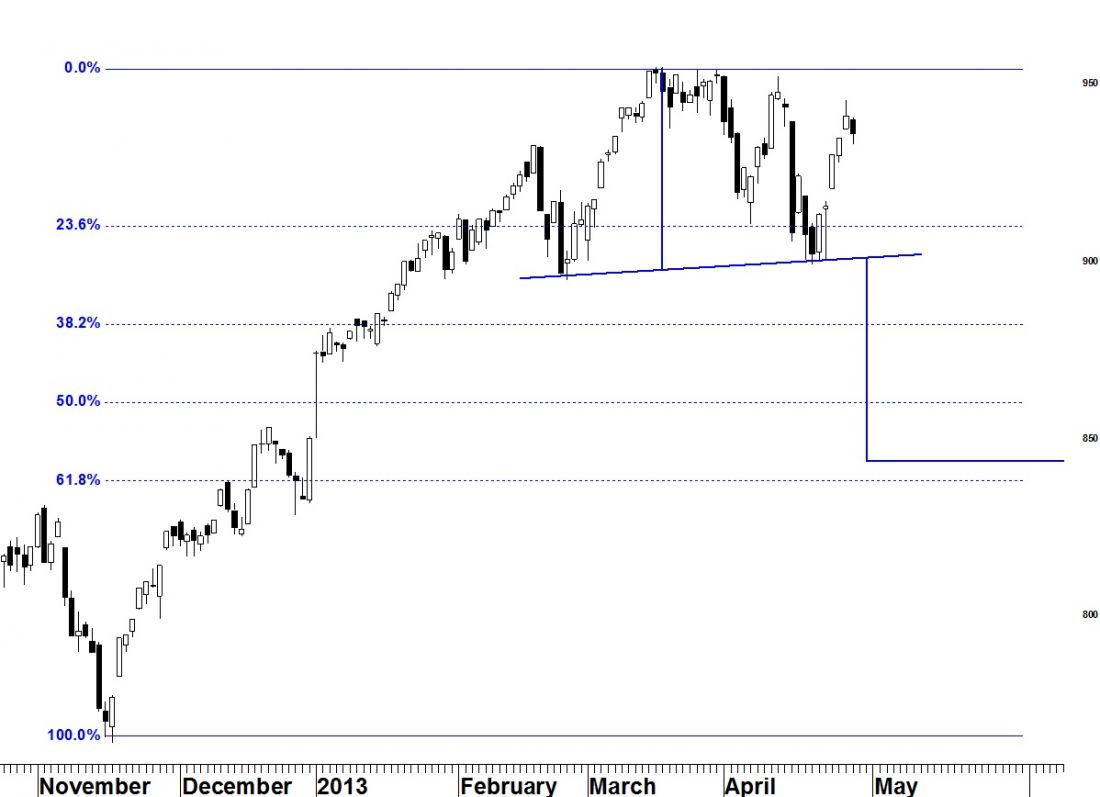
A head-and-shoulders top appears to be forming in RUT. A breach of the neckline at 900 calls for a minimum move to 843 which is near the 61.8% retracement of the November rally.
= = =
[For more information try a ‘sneak-peek’ at Seattle Technical Advisors.]

