

Market volatility has become one of the most important factors to monitor and many market players are finally treating it like a different asset class.
EYE ON VIX
It goes without saying that the most popular volatility index is the VIX, which tracks the volatility of the S&P 500 options market. Also, VIX futures are now showing consistent volume on a daily basis.
KEY CORRELATION
Many traders are aware of the inverted relationship between price action and volatility but we will try to provide a more in-depth analysis of the dynamic. Figure 1 below plots the performance of E-mini S&P500 futures against the VIX.
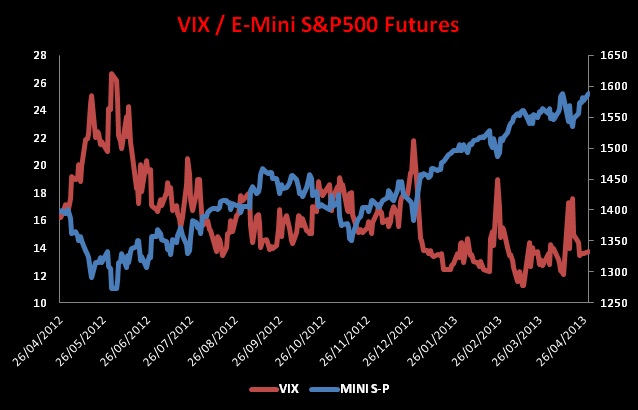
The negative correlation is rather evident and the fact that the VIX tends to present sharp spikes when S&P futures are plummeting is easy to spot. But, why is that? In order to answer this question we have to understand what the VIX tracks and more about the nature of the options market. Let’s proceed with those issues one at a time.
HOW IT WORKS
Generally speaking, the VIX formula puts a lot of emphasis on S&P 500 ATM call and put options in the first and second SPX contract months, with a continuous rollover when the expiration parameters are not met anymore. Furthermore, the equation considers variables such as time to expiration, options strike prices and the bid/ask spread width. The calculation tends to provide a fairly accurate measure of the volatility surrounding the ATM area and this is where we need to focus our attention.
Now we know what the VIX measures and how it works so we can move on the second point– the nature of the options market.
Many market players, particularly large investors and money managers, have several long positions on single stocks or equity indices and it would be inconvenient for them to get out of the market all the time there is a correction in the trend. Therefore, they prefer buying put options because by doing so they can limit their portfolio risk and, at the same time, they can keep their long trades on while waiting for the next ride.
IT’S LIKE INSURANCE
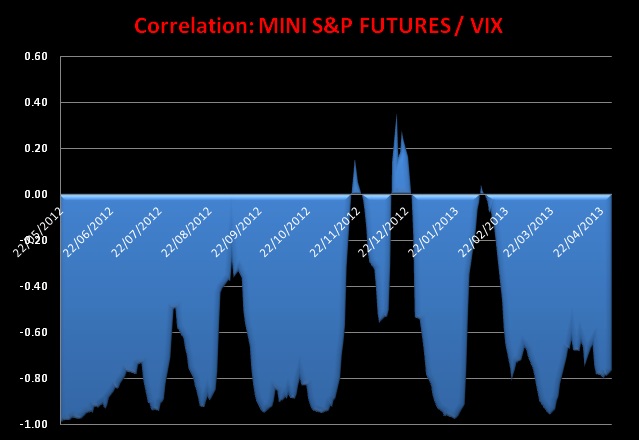
At this point the nature of the options market should be clear– it works like an insurance policy. Let’s now link the above reported information to the VIX index. Market players, when S&P futures plummet, rush to buy put options to protect their long portfolios and push their prices up. Consequently, the volatility of the S&P ATM put options dramatically increases and, given the fact that the formula of the Index is largely influenced by volatility oscillations in the ATM zone, we have a net uptrend in the VIX Index while the futures market keeps plunging. Figure 2 presents the correlation between E-mini S&P 500 futures and the VIX.
LIMIT RISK
The correlation index is clearly negative and, if we exclude short term periods of spurious correlation, the average quantification of the aforementioned markets’ relationship is -0.79. Clearly, the above reported graph confirms the contrarian nature of the VIX Index and it is a further proof that holding VIX futures in a potential portfolio is definitely a good strategy to limit market risk.

