FSLR is one very interesting stock to trade.
It was quite cheap not too long ago. Only one year ago, it was trading around $12.00. Now it’s in the mid 50’s. FSLR was in a larger bearish trend since the solar bubble burst back in early 2011. The reversal signals were apparent once it began hitting the $12.00 region.
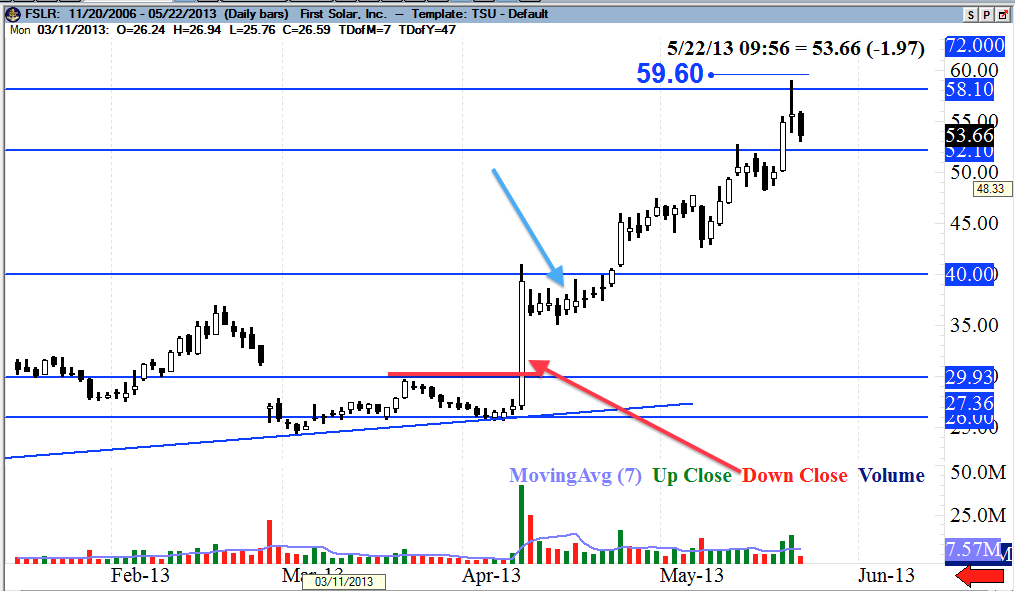
First, an inverted head and shoulders formed. Then from August – November of 2012, FSLR broke out of a strong ascending triangle. Nice little profitable move for some of our students. FSLR came back to retest that break out in March/April of 2013. A gorgeous double bottom formed with one of the most amazing and exciting long day candles I’ve ever seen, on 4/9/2013. The size of the candle, rapid move, wildly strong volume, the filling of a previous gap and the completion of a double bottom chart pattern. The red arrow points to that candle and the red line denotes the neck line of the double bottom.
When FSLR closed above the neckline of the double bottom, I said a key phrase in one of my classes. “FLSR is bullish everyone. Let’s wait for a few days of sideways movement and then ride this wave.” Blue arrow points to the sideways move that occurred for, as it’s been scientifically measured “a few days”.
The pink vertical line shows the day of earnings for FSLR. A little black candle and a pullback emerged and we continued the bullish trend, trading right to my next two targets of $52.10 and then $58.10. If FSLR closes above $59.60 it’s likely the trend will continue. FLSR had exceptional volume on 5/20/13 and 5/21/13. A high wave doji is a clear indication of some slow down, likely for “a few days”, giving the buyers of this stock some time to rest. A continuation is likely but I have no problem simply waiting for the analysis to confirm. The next targets, realistically, are around $72.00 and $87.00. $66.37 is a Fibonacci price extension where FSLR could also get some slow down.