

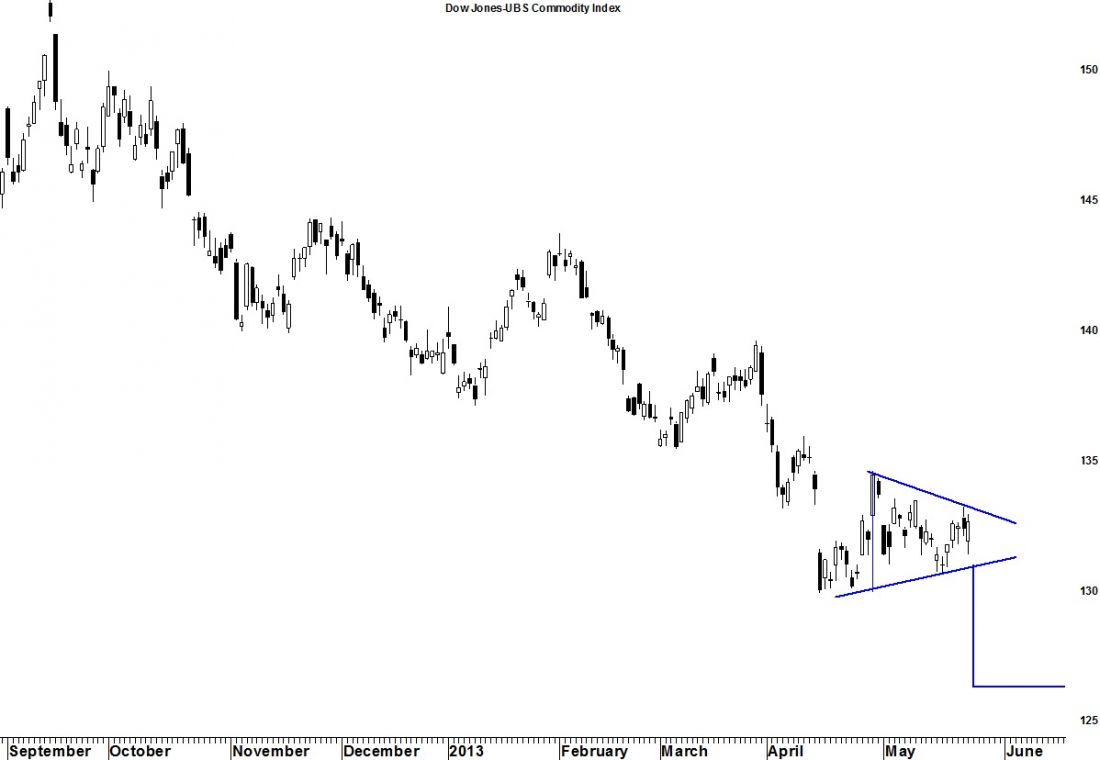
In my May 6, 2013 commentary, “Have Commodities Bottomed?” I discussed my expectations for a temporary low in the commodity complex near the end of May. Since that time the DJ UBS commodity index has essentially moved sideways forming a triangle pattern on its chart. Triangles are typically thought of as continuation patterns. In this case, that would be a continuation of the previous decline from last September and should give us one final decline into the expected low this week.
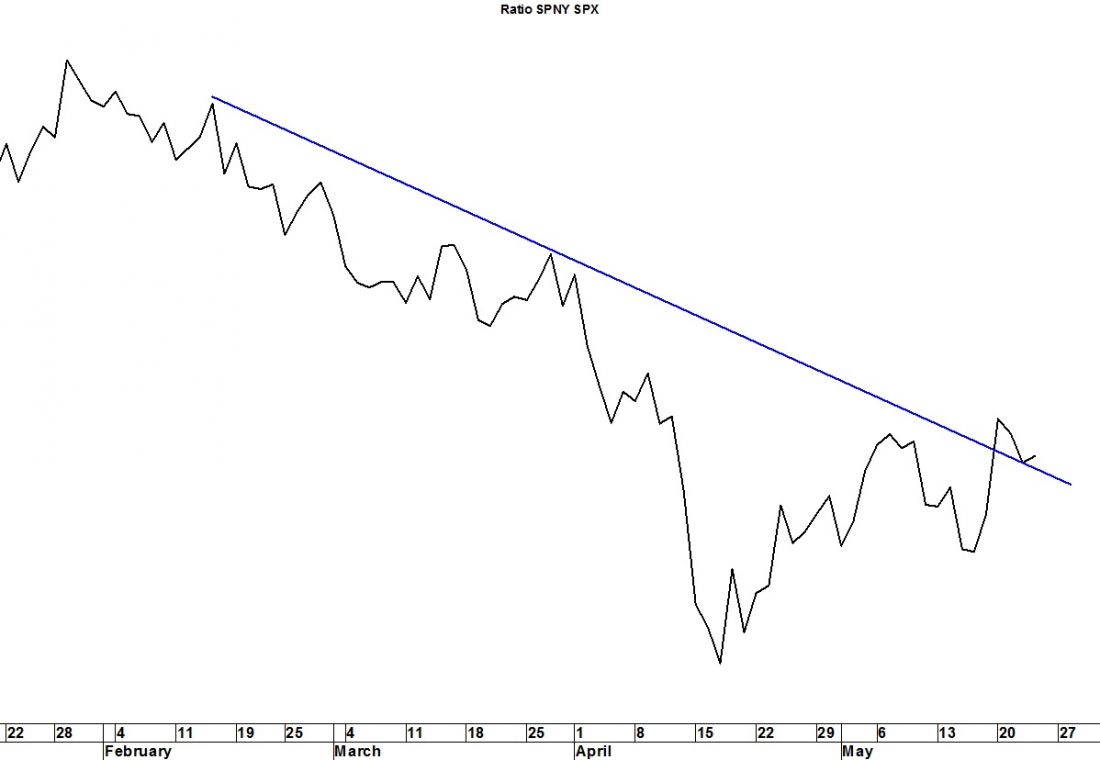
Commodity-linked Equities typically lead their underlying hard assets and last week we saw evidence of an eventual low in two sectors; energy and materials. The relative performance of both sectors has turned up breaking their 2013 decline in relative performance. That trendline break can be seen in the ratio chart (Energy vs. SPX) below.
= = =
Request log-on info for a Free on-line webinar, Mapping the Market with Lindsay, this Thursday, May 30 at 1:15pm Pacific, 4:15pm Eastern at Seattle Technical Advisors.com.

