Since the beginning of the year, the market has really seen a nice recovery in “dinosaur computer stocks” or better known as solid blue chip technology stocks: MSFT, HPQ, DELL and also INTC have all had nice gains since December 2012.
TOP PICK
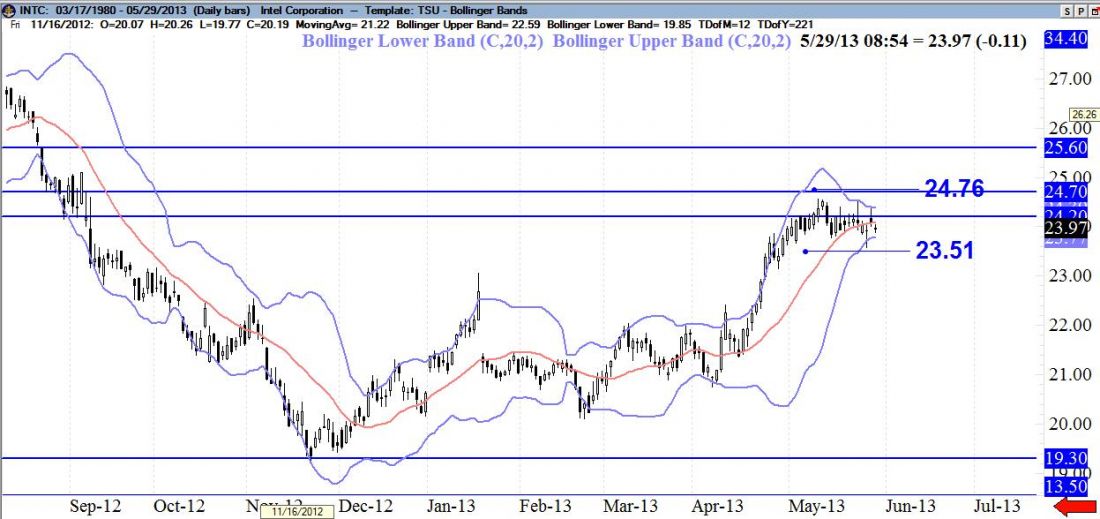
The majority of momentum indicators are totally flat and/or neutral on Intel Corp. (INTC) currently. It’s in what’s known as a Bollinger band squeeze. This represents very low volatility in the stock.
DIGGING DEEPER INTO THE CHART
Long term moving averages are about to cross bullish, INTC is above the 50 exponential moving average and is resting on the 20 EMA as I write this article on Thursday May 30. INTC had some great bullish volume during the later part of April and the beginning of May.
KEY LEVELS
I would want a close above both prices on INTC. There are some strong candle wicks on 9/7/12 and 9/10/12 which represent strong selling pressure around 24.70.
HIGHEST PROBABILITY
If the buying pressure is strong enough to keep the stock’s price above 24.76 and the stock closes above that price, the bullish trend would very likely continue to the next target of 25.60 and then 26.90. I like the 5/24/12 candle with the lower wick. It shows a lot of buying pressure. This trade could really break in either direction. A bullish break, in my opinion, would be the most robust and highest probability.
This is a very emotional free trade. Make sure to have solid contingency orders placed and remember to always mitigate your risk!