

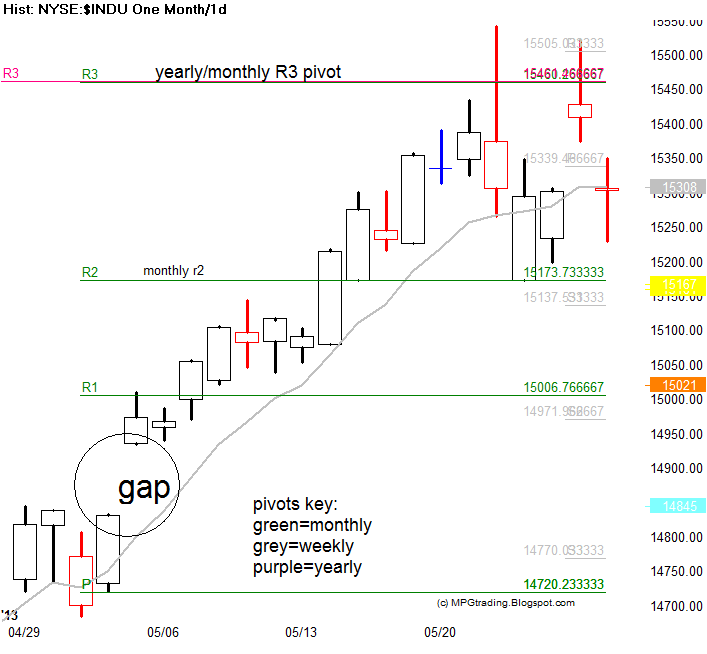
This past week, the Dow Jones (DJIA, INDU) index etched a double top at the “yearly R3 pivot point (YR3).”
Market makers, specialists, quants/Algos traders all use yearly pivot points as a predictive indicator on where the market will turn.
POTENTIAL TOPS AND BOTTOMS
Like day traders who rely on intraday pivots and swing traders rely on weekly and monthly pivots, yearly pivots indicate where to look for major support and resistance: such as potential tops and bottoms.
SMART MONEY ACTION
On Figure 1 below, you can see the Dow Jones failed at the monthly and yearly R3 pivot points. That is where smart money is taking some profits off the table. They know the statistical odds are around 88% that the YR3 pivot point could be a potential major turning point.
Most years the high and low occur at a yearly support or resistance pivot point on the indices and on many stocks.
TRADING PLAN
Pivots make a great trading plan, because they show you where to buy and sell at (buy support, sell at resistance). The S&P 500 got close to its yearly R3 pivot (YR3) at 1725. Maybe we have a little more to go before we see a correction in the third quarter? Either way, (INDU YR3 or S&P YR3), this could be the start of a major topping process.

