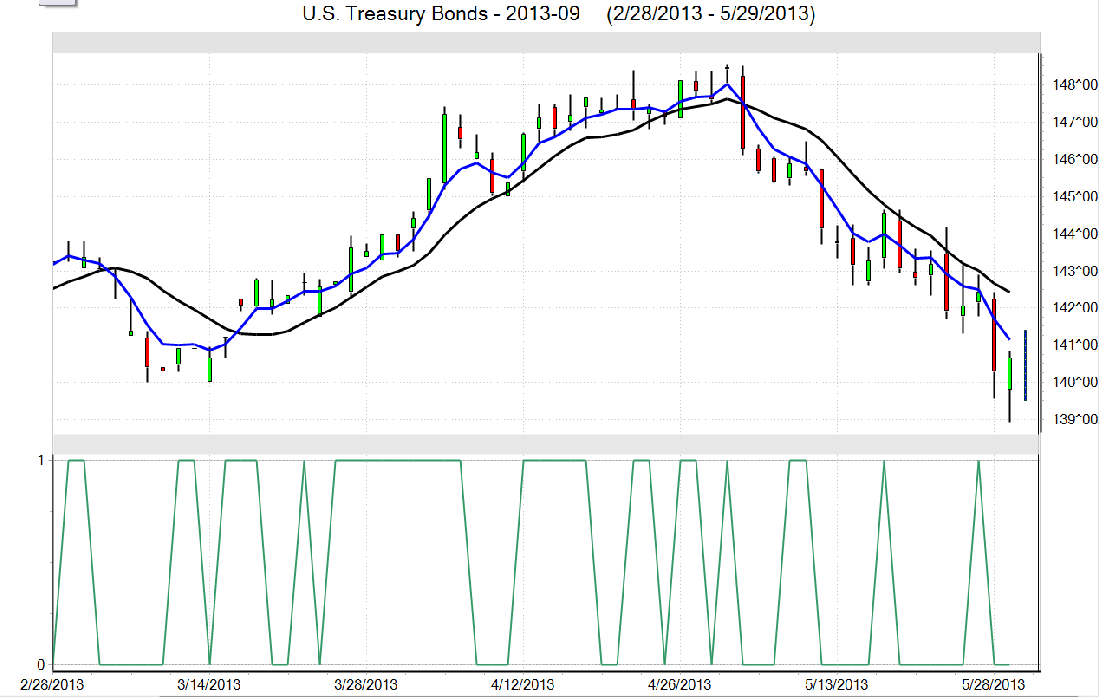
September U.S. Treasury bond futures (US U3) on the Chicago Board of Trade have seen a dramatic sell off recently. Prices are in a steep four-week-old downtrend on the daily bar chart and have this week hit a fresh contract low. The bears are in full near-term technical command and there are no early, significant technical clues to suggest a market bottom is close at hand.
The next upside price objective for the T-Bond futures bulls is closing prices above solid technical resistance at 143 even. The next downside price objective for the bears is closing prices below solid technical support at this week’s contract low of 138 30/32.
The T-Bond futures market can be an important “outside market” that can have a significant influence over other markets. My friend and market analysis software pioneer Louis Mendelsohn has been studying this markets relationship phenomenon, called Intermarket analysis, for decades. No trader should overlook or underestimate the importance of the Intermarket phenomenon.

From an Intermarket analysis perspective provided by VantagePoint Intermarket Analysis software (www.TraderTech.com), it appears September T-Bond futures prices will continue to see selling pressure in the near term.
VantagePoint is a valuable trading tool for which a trader can glean clues on potential near-term price trend changes or continuation of present trends. These near-term clues provided by VantagePoint can and do give a trader a key edge.
See on the VantagePoint daily bar chart for September T-Bonds that the Predicted Medium Term Crossover study shows the blue predicted 4-day exponential moving average is below the actual black 10-day simple moving average close, and both lines are trending lower, which is a near-term bearish technical signal.
The Predicted Medium Term Crossover is the predicted 4-day exponential moving average of typical prices two days ahead (P4EMA+2) crosses above or below the actual 10-day simple moving average close (A10SMA).
It’s the early technical clues such as the Predicted Medium Term Crossover, provided by VantagePoint, which are so valuable to traders in their quest for consistent trading profits.
Also see at the bottom of the daily chart for September T-Bond futures that VantagePoint’s Predicted Neural Index (PIndex) is also in a bearish mode, with a reading of 0.00. The PIndex is a proprietary indicator that predicts whether or not a three-day simple moving average of the typical price will be higher or lower two days in the future than it is today. The Predicted Neural Index compares two three-day moving averages to one another – today’s actual three-day moving average with a predicted three-day moving average.
When the predicted simple three-day moving average value of typical prices is greater than today’s actual three-day moving average value, the Predicted Neural Index is “1.00,” indicating that the market is expected to move higher over the next two days. When the predicted simple three-day moving average value of typical prices is less than today’s actual three-day moving average value, the Predicted Neural Index is “0.00,” indicating the market is expected to move lower over the next two days.
The Predicted Neural Index is either correct or incorrect so its performance can be measured in terms of percent correct to produce the accuracy statistics cited for VantagePoint, which has a predictive accuracy rate of around 85% across a wide range of markets and time spans in ongoing research.


