I cut my teeth in markets as a foreign correspondent covering metals spot and futures markets in Tokyo, Japan in 1999.
You could say my professional upbringing was unique. My managing editor was drilling into my head that price moved in response to changes in supply/demand fundamentals; traders on the Tokyo Commodity Exchange were the cool kids insisting that fundamental news was bad hair metal and moving averages and overbought readings were punk rock.
There’s no doubt that markets are driven by changes in supply and demand, but those opposing views nurtured an early skepticism about markets always moving on news that served me well as a reporter and later as a market technician.
Over the years it became clear to me that trading based just on overbought and oversold readings was a great way to lose money, and a more nuanced interpretation of momentum based on different time frames was required to understand what role smaller market moves served in the larger context. That’s important because the smaller moves often present opportunities to initiate trades in the direction of the larger trend. This is my primary focus for swing traders at mianalysis.
THE RSI
Before moving on to the charts, I want to briefly explain the momentum oscillator I use for this set-up. Most of you are familiar with J. Welles Wilder’s relative strength index (RSI). It measures momentum by plotting a line based on where price closed relative to the range of prices over the past N periods (the default is 14). When price closes near the top of the range, the indicator rises, and vice versa. Readings above 70 or 80 indicate an overbought condition that warns a point of buyer exhaustion is approaching, while oversold readings beneath 30 or 20 point to seller exhaustion.
CUSTOM SETTING
I use a 13-period simple moving average of RSI in order to reduce false signals, better understand the trend in momentum, and identify signals in between the overbought and oversold thresholds. Connie Brown provides an excellent explanation of RSI averages in her book, “Technical Analysis for the Trading Professional.”
TRADING SET-UP
The set-up is to go short when this indicator tests the 50 midpoint line from below on a shorter time frame while momentum is deteriorating on the daily chart. It suits swing traders with a time horizon of about two to 10 days. Let’s look at two examples with SPY (SPDR S&P 500 ETF Trust).

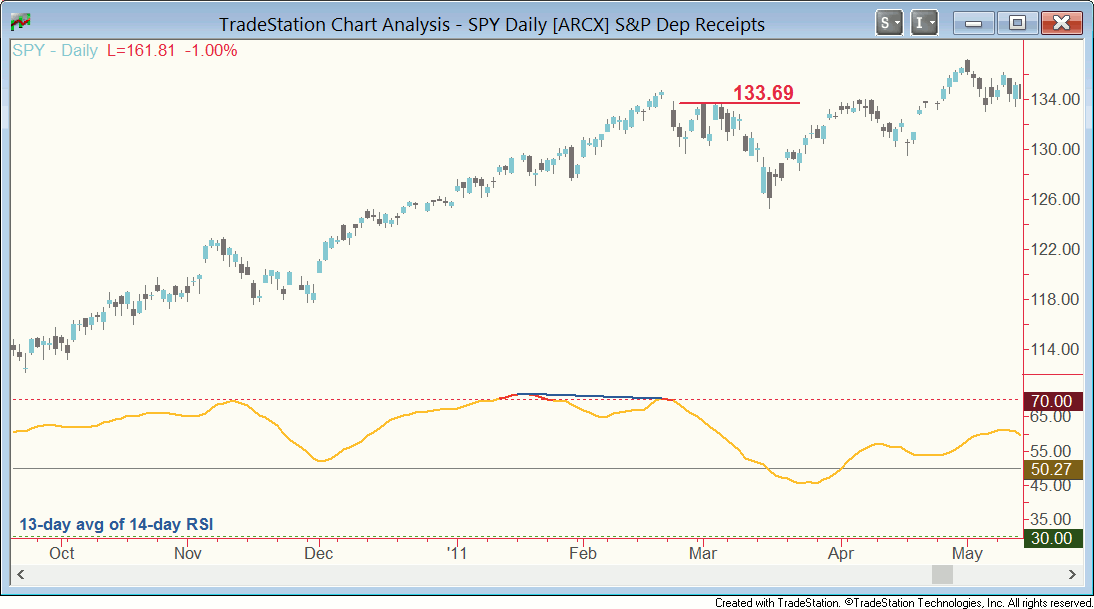
This first is in March 2011. Price had come down from a peak in February. The daily chart (figure 1) showed a bearish momentum divergence in that the higher price in February coincided with a lower peak in the oscillator, while still above the 70 overbought threshold. The pace of the advance was slowing after a great run. That was an early warning that the uptrend was at risk. At the very least, you didn’t want to be buying.

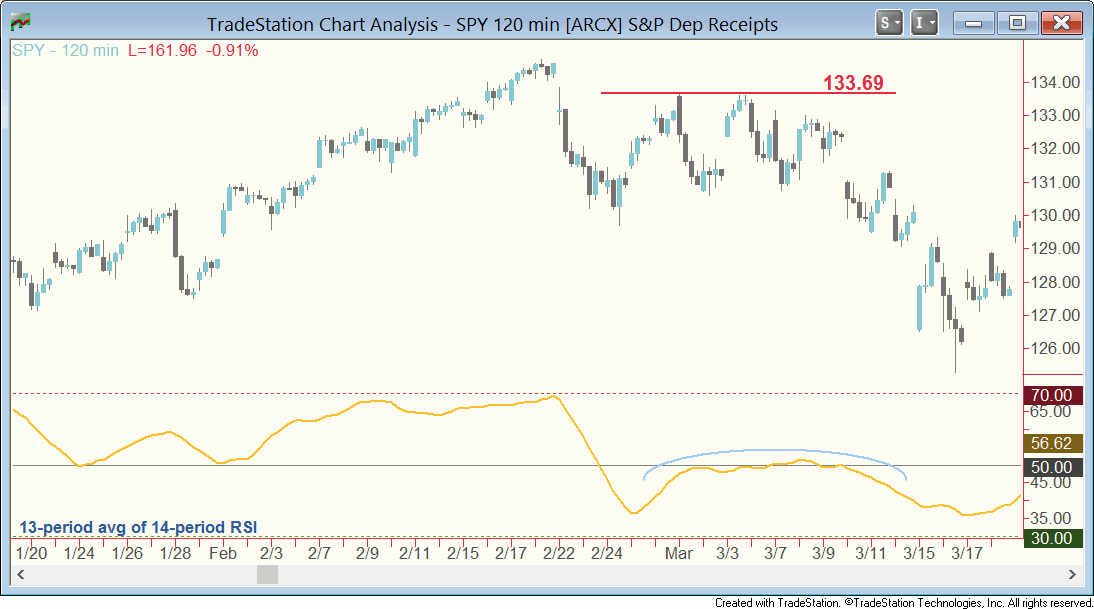
Now we move down to the 120-minute interval chart (figure 2). After an initial sell-off from 2/22 to 2/24, SPY recovered and the RSI average turned up. Price hit a ceiling at 133.69 that showed demand wasn’t strong enough to propel SPY above the February high. Concurrently, the indicator flat-lined at the 50 midpoint line. Taking into account the slowing momentum on the larger time frame, strengthening momentum on the lower time frame suggested the recovery was a countertrend move. The 133.69 ceiling provided a gauge for a stop loss on a short position, with reward potential based on the range in early March resolving down. Subtracting the height of the range from the bottom of it yielded a measured move of 127.51, which turned out to be a decent exit point.

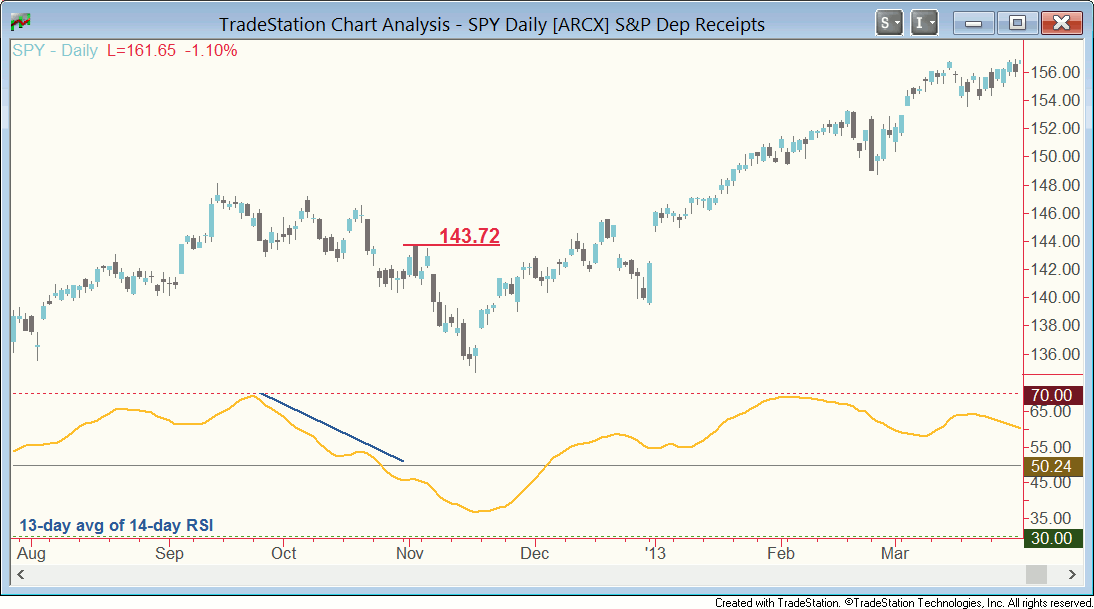
Now look at another example in November 2012 (figure 3). In late October SPY broke down from a range that started forming in mid-September. That was an early warning that the technical structure was weak: anyone who bought when the range formed was losing money and under pressure to sell in order to limit the loss, while those who sold short had their view of the market validated, lending confidence to add to positions. Additionally, the 13-day average of 14-day RSI was in a steady decline.

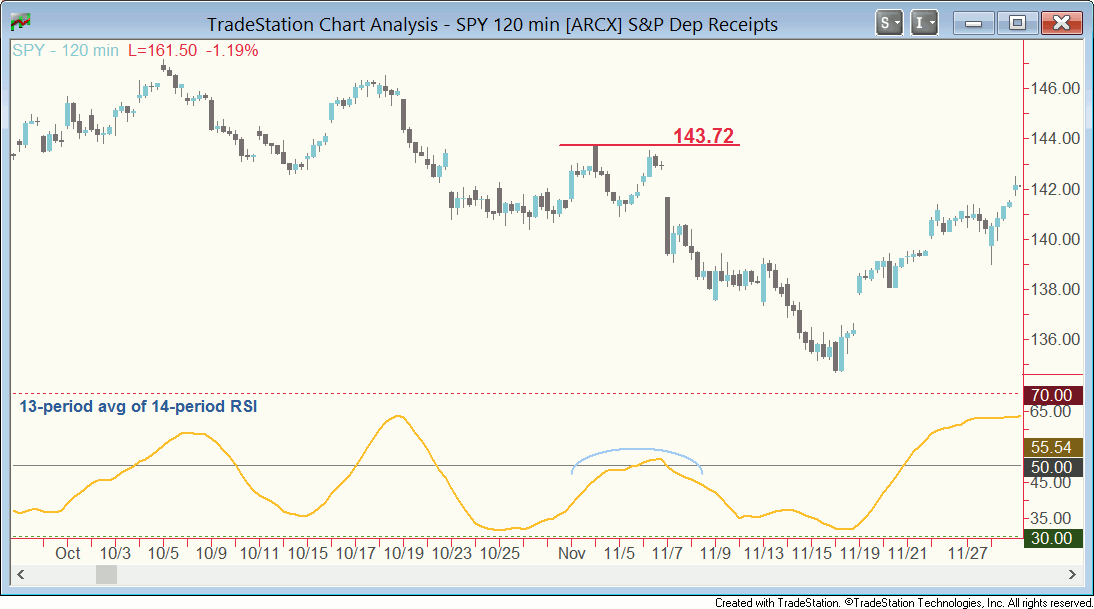
Next, move down to the 120-minute chart (figure 4). The RSI average on this time frame had begun to recover in late October and SPY turned up. But the lift ran into selling at the bottom of the range, which now represented a supply zone. A ceiling emerged at 143.72 and the rise in the indicator started level off around 50. This signaled an attractive short entry scenario with a stop loss above 143.72. Reward potential could be calculated by the measured move based on the range, which was 138.00.
This is one set-up to consider in your repertoire. Trading success comes through acting on just a few well defined set-ups with a decent success rate. Be comfortable missing moves as you wait for your criteria to be met, and remember that those who are still trading 10 years after they started are often the ones who trade less.
—All my best to everyone, Chris Burba, CMT.
===


