
The $88/oz. drop in gold last Thursday surely got the attention of a few —instilling fear in those who are still long the metal and greed in those who are not.
While I doubt a final low will be seen in gold until the end of the year (the subject of another commentary) the time for a short bounce appears to be upon us.
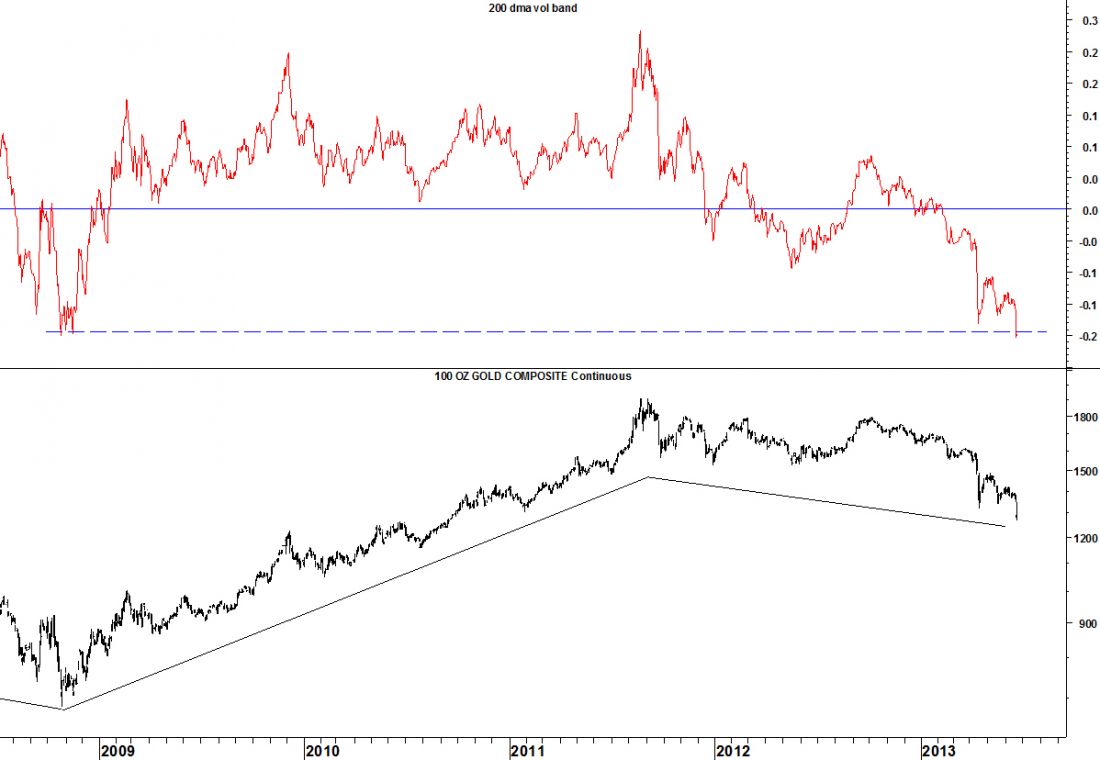
The red line in Figure 1 measures the distance between the continuous gold futures contract and its 200-dma. Gold’s distance from its 200-dma has been stretched to an extreme not seen since the low in 2008.
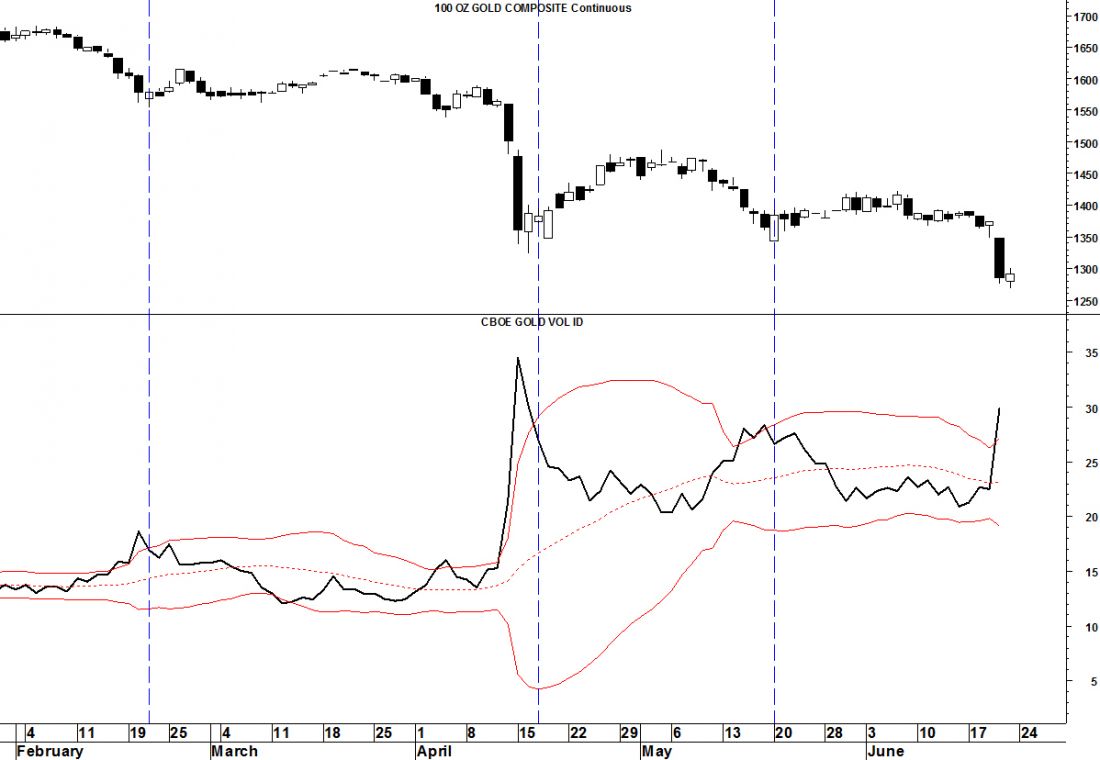
Looking at the CBOE Gold Volatility index (GVZ) we can see it has moved above its upper Bollinger Band. A move back below 27 would be a buy signal in this indicator.
Unfortunately, the expected rally looks to “taper” off no later than mid-July.
= = =
For more analysis experience your own ‘Sneak-Peek’ at Seattle Technical Advisors.com

