
The yellow metal has traded close to its lowest in almost three years on Friday, its worst quarterly performance since at least 1968, as worries that the Federal Reserve will wind down its money easing punctured confidence in the metal as an inflation hedge.
Since the recent FOMC meeting on 18-19 June, the gold futures have lost 12%. The Fed announcement and some stronger U.S. data, such as pending home sales surging 6.7% in May compared to a median forecast of 1%, and jobless claims dropping 9.000 to 346.000 in the recent week, have pushed the price down further this week.
Added to this we must take into account that institutional investors have been liquidating their gold positions for month-end and quarter-end window-dressing. This has had a negative impact on the commodity.
On the other hand, although there are some bright spots in the U.S. economy, a reason for maybe reducing stimulus, I personally don’t see the rest of the world synchronized with this upturn in growth.
As an example, the SSEC composite Shanghai index has dropped hard this past month breaking the strong support of 2.000 points and currently looking to possibly test previous 2008 low of 1.700 points.
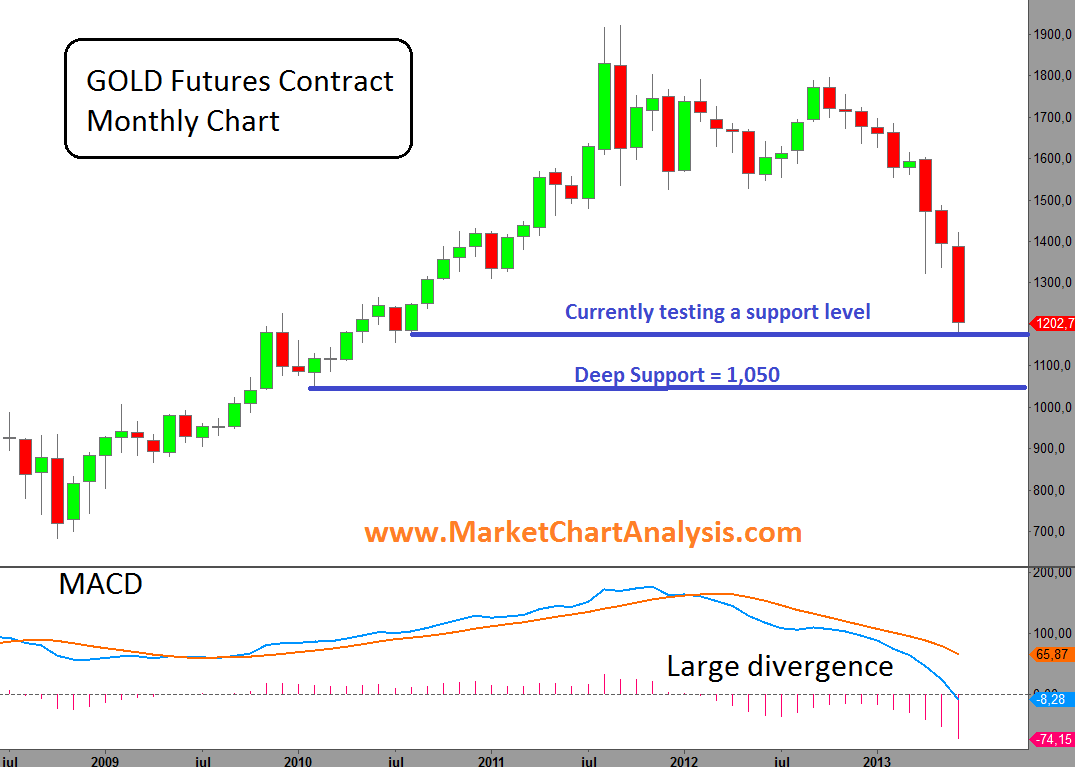
CHART ANALYSIS
On the monthly chart above we can see how the price is testing an important support level (1.200 USD) currently trading below that during the session of today. The next important and deep support could be pointed out at $1.050.
However, the MACD indicator shows an important large divergence. This could be the first sign of a possible upcoming bounce.
PROFESSIONAL SENTIMENT INDEX
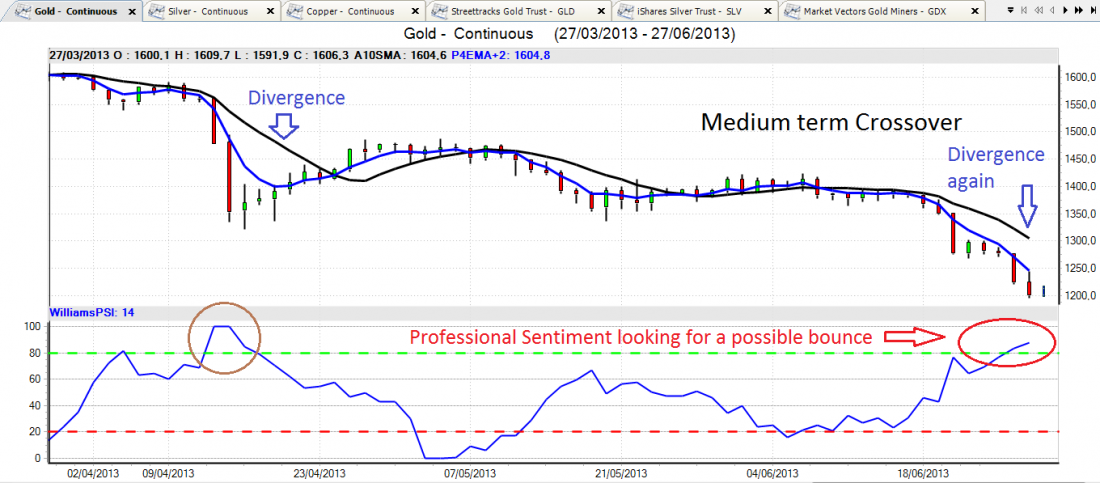
On the Vantage point chart above, we can see another divergence between the 10 day simple moving average and the predicted medium term crossover. The last time this happened, the price of gold spiked $150 approximately.
This also coincides with the moment that the new premium indicator of Vantage Point –the Williams Professional Sentiment Index (PSI) crossed the 80 points mark. This indicator measures the sentiment of professional traders as a group. When they are bullish, prices are likely to move up; when they are bearish, prices are likely to move down. Unlike typical oversold/overbought oscillators, when the Williams PSI Index moves above its upper threshold, it doesn’t indicate an overbought situation to short but suggests going long in line with the bullish professional crowd.
BOTTOM LINE
It’s very hard to call a bottom here, but the reasons for investors to keep selling and shorting gold seem to be drying up. The physical market is still very much in play and the world economy is not replicating yet the good data from the United States.
Although we could still see lower levels, a major bottom could be near. The important issue here is to consolidate and hold at a solid level, and then we can resume our long positions in this market, as the global economy is not yet ready to live without gold.

