

I use moving averages as tools for finding support for resistnace levels in prices on charts. Moving averages work as indictors because they are used by many other market participants to make buy and sell decisions. Unlike chart pattterns and trend lines that are subjective based on opinions on charts moving averages are a way to quantify signals to use for possible trend identifcation.
It is very interesting to lay a 50-day and 200-day simple moving averages (sma) on to a chart for the past year. You will begin to see patterns develop. Bounce off the 50-day, a last chance for support at the 200-day etc. Each stock and ETF has different key moving averages and different reactions to them on the chart. It can really help your trading to know the key moving averages for what you are trading and clues to support and resistance, they give clues as to where the buyers and sellers are waiting.
MY BEST TRADES
Some of my best trades have been simply making an entry after the breakout above a key long term moving average like the 200-day and then capturing the trend using the 10-day sma as a trailing stop. Moving averages are not magic indicators but they are fantastic technical analysis for quantifying and capturing trends.
TEN THINGS TRADERS NEED TO KNOW ABOUT MOVING AVERAGES.
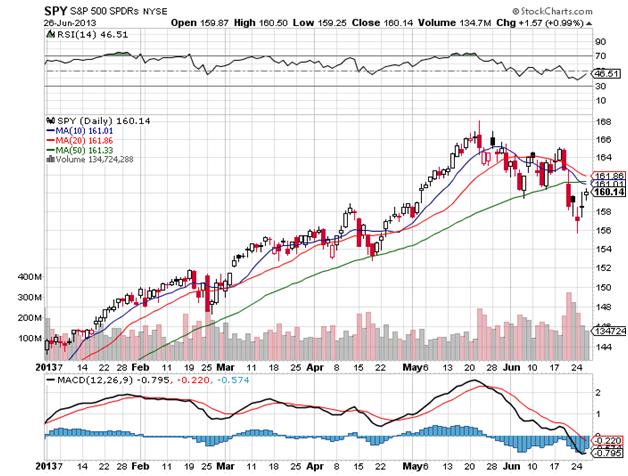
1. Here are three of the most meaningful moving averages in the stock market. The 20-day moving average commonly acts as a reversion to the mean in a range-bound market. The 50-day moving average can act as the line of support for an intermediate uptrend or resistance in an intermediate downtrend. The 200-day moving average is the ultimate dividing line for the long-term trend of the market. The SPY is generally the best tracking ETF for the market as a whole.
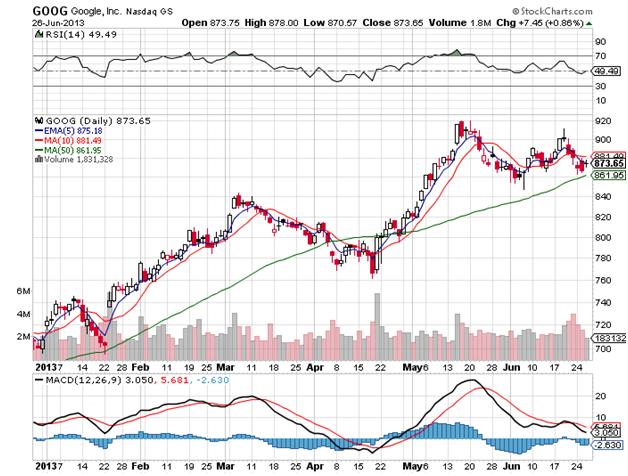
2. In sharply trending markets the 5-day exponential and the 10-day simple moving averages have meanings as support and resistance to help manage your position when the longer term moving averages are too far away to use.
3. Exponential Moving Averages apply more weight to recent price change, while Simple Moving Averages view each data point equally.
4. Moving averages let you see where other traders both big and small are buying and selling. The meaning of moving averages as support and resistance points on charts rely on how other traders are reacting with buying and selling when the prices approach those key levels.
5. Where the price on the chart is in relation to the 200-day moving average is determined by long-term investor and trader psychology. Bulls like to stay above the 200-day moving average, while bears sell short below it. Bears usually win and sell into rallies as prices approach this line when the 200-day becomes resistance, and bulls buy into pullbacks to the 200-day when the price is above it. This line is one of the biggest signals in the market telling you which side to be on. Bull above, Bear below.
6. When the 50-day moving average pierces the 200-day moving average in either direction, it supposedly predicts a substantial shift in buying and selling behavior. The 50-day moving average rising from below and crossing through the 200-day moving average is called a Golden Cross, while the bearish piercing of the 50-day from above the 200-day moving average is called a Death Cross.
7. A great second chance entry on a momentum stock is with a bounce off a 50-day moving average as support for the price action. Many institutional buyers are waiting at the 50-day sma to add to their long term positions in major growth stocks that they are accumulating.
8. Getting a monster stock at the 200-day during a bull market is like a gift from the trading Gods. However if the 200-day is lost it is very dangerous and could begin a fall with no net, this is a time to short the old leaders when the 200-day is breached and the stock begins what could be a death plunge.
9. Some traders use systems that give buy and sell signals when a shorter term moving average crosses over a longer one or vice versa. Legendary trend trading pioneer Richard Donchian used a five and twenty day moving average cross over system for buy and sell signals to capture trends.
10. Some traders watch for when a moving average begins to slope upwards or downwards and consider it as a signal of a trend beginning, continuing, or changing.
Each trader must decide how to incorporate moving averages into their own system and time frame. But these are the major tools of some of the world’s best traders.
See two charts below.
===
Related Reading:
Capture More Trend with Moving Averages

