“You must understand that there is more than one path to the top of the mountain” –Miyamoto Musashi, A Book of Five Rings
We’ve been talking a lot recently about different ways to look at the market and different trading strategies. We all look at the same data. All of our euro graphs are going the same direction at the same time. So, if the market is out to get one of us, as so many novice traders are fond of believing, it’s rather a collective endeavor. But how we interpret what we see in the market is the difference.
THE TRADING JOURNEY
How a trader interprets the market often has a bit of a lifecycle. Often the new trader likes to put about 15 indicators up on their screen thinking all the lines will somehow give them a clearer way of finding out which way things will go. As the trader matures, this often swings the other direction and 15 indicators go down to about three. If the trader is in the game long enough, different indicators start popping back up on the screen again and eventually they either give up or find a combination that works.
The key is that technical trading and indicators all work some of the time and have their uses. The hard part is knowing which indicator works in the market environment you’re trading in and using it correctly. I’m still a bit of a minimalist when it comes to things up on my screen but I’m learning to throw in a few extras here and there when they look like they might be useful.
MARKET ACTION
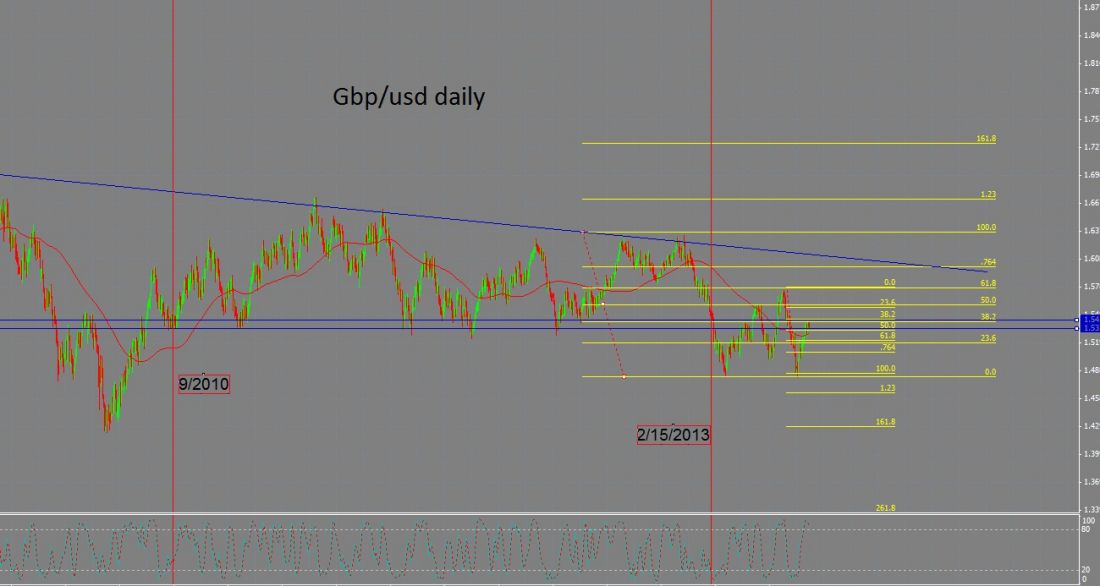
The pound broke below a multiyear bottom back in February of this year. Since then, it’s rebounded and consolidated some to retest prior levels. On the daily chart, it’s respecting prior levels and Fibonacci retracements almost to the pip. Obviously, the key to trading off levels is figuring out which one will hold. Currently, we are on a .382 retracement of a fairly significant daily / weekly move. This is also a .618 retracement of the more recent daily selloff (on the graph this is the smaller Fib retracement I have up there). In addition, this is the level which had been holding until it didn’t.
AGGRESSIVE PLAY
Of course I don’t know if this level will hold or not, but it looks pretty decent to me. An aggressive trader may short around current levels, place a stop up above and hope for the best. The more conservative trader may use a system similar to the one we’ve been talking about and wait for a regression trend channel (or just trendline) break on a lower timeframe chart, like one or four hour. And if you want icing on the cake, the daily stochastic is overbought and looks like it wants to cross back under the daily 80% line. If all these things line up together, you may not have a winning trade, but you have a pretty solid trade setup.