

Transports had been a strong performer against the S&P 500 from late-September ’12 through March ’13, then we saw a shift in performance and the transports haven’t been able to pick themselves up since.
DOW THEORY CONFIRMATION
Dow Theorists believe that as the Dow Jones Industrial Average hits a new high (or new low) it needs to see confirmation from the Dow Jones Transportation Index. When the Industrials hit that new high a few weeks ago we saw Transports signal their confirmation a few days later. This helps endorse the bull market we’ve seen in equities. So things are good and great right? Well not so fast.
ETF ANALYSIS
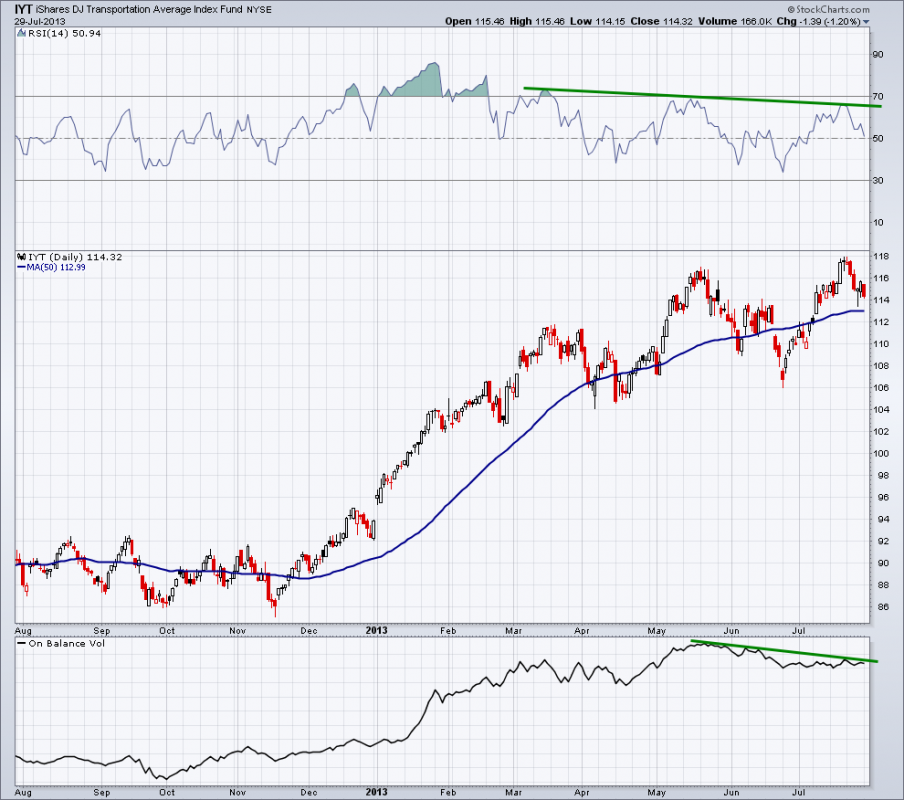
Today we are going to look at the iShares Dow Jones Transportation ETF (IYT). As it’s been trekking higher during 2013, meeting the demands set by its big brother, the Industrial Average, the internals appear to weakening. In January we saw the Relative Strength Index, a momentum indicator, break above 70, then above 80, and almost touched 90 as buyers keep the momentum rolling.
Overbought momentum isn’t necessary a bad thing, it just tells us there is strong forces keeping prices elevated. Price can advance in the face of an overbought RSI indicator. What’s worrisome is when price continue to rise and momentum wanes. When IYT hit a new high May RSI didn’t break above 70, giving traders a small yellow flag and when another new high was reached in July RSI had become even weaker, creating a divergence from price as shown by the falling trend line on the top panel of the chart below.
ON BALANCE VOLUME
Turning our attention to volume, we can see in the bottom panel of the chart the On Balance Volume (OBV) indicator. This simply adds volume on up days and subtracts it on down days to give a sense of buying and selling pressure within a security. OBV had been rising with price, confirming the new highs… until recently. With the climb higher in IYT in July we see On Balance Volume diverging lower, indicating buying pressure might not be as strong as price action makes it appear.
BOTTOM LINE
Going forward I’ll be watching the 50-day moving average as possible support and if momentum can regain some strength and stay above the 40 level on the RSI indicator. The two negative divergences in momentum and On Balance Volume need to be corrected, we’ll see if bulls step in to fix the imbalance.
Disclaimer: The information contained in this article should not be construed as investment advice, research, or an offer to buy or sell securities. Everything written here is meant for educational and entertainment purposes only. I or my affiliates may hold positions in securities mentioned.

