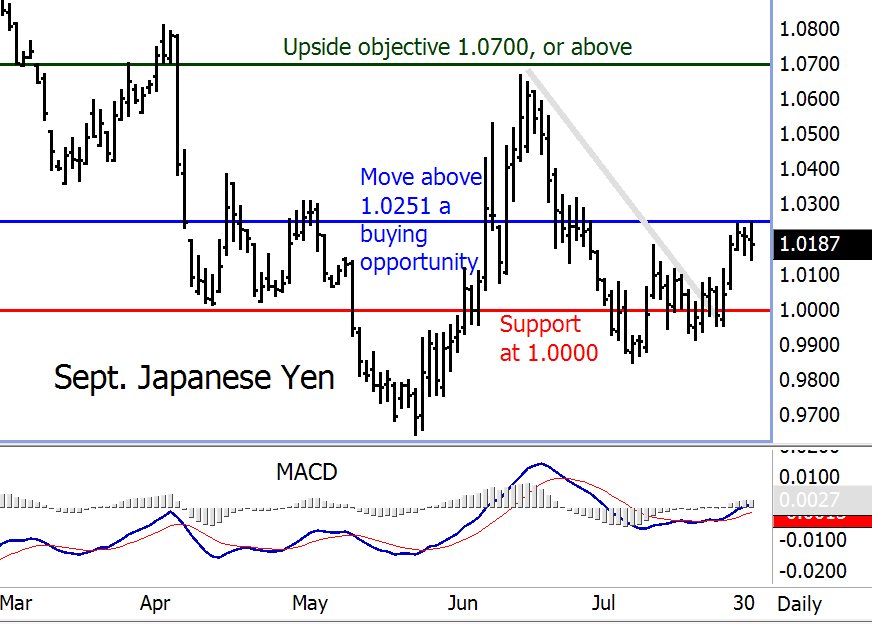
September Japanese yen futures a buying opportunity on more price strength.
See on the daily bar chart for the September Japanese yen that prices Wednesday hit a fresh five-week high. Price action last week also saw a bullish upside “breakout” from a sideways congestion area on the daily chart. See, too, at the bottom of the chart that the Moving Average Convergence Divergence (MACD) indicator is also in a bullish posture as the thick blue MACD line is above the thin red “trigger” line and both lines are trending higher. The yen bulls have gained upside near-term technical momentum. A move above chart resistance at Wednesday’s high of 1.0251 would become a buying opportunity. The upside price objective would be 1.0700, or above. Technical support, for which to place a protective sell stop just below, is located at 1.0000.


