

The stock market is very sneaky and will usually make drastic moves to the downside, when everybody is looking for more upside. Very rarely will you see a major move down when the majority is expecting that to happen. There will be pullbacks, but they are usually short-lived and new highs will hit shortly after, as long as the majority are expecting a move lower.
A CHECKLIST
There are certain characteristics of the markets that take place almost all the time, when the indexes are about to approach an intermediate or long-term top. In order of importance, this is what you have to look at to identify market tops.
- Time
- Sentiment or Investors Expectations
- Market Breadth
- Price and Price patterns
Time Profiles: Major tops are made after the markets have been going up for a long period of Time. Over the last 13 years, bull markets have lasted from 4-6 years, as bear markets lasted from 1.5 years to 3 years. Based off our 13 year time window, we can determine that the time piece has been fulfilled for the bull market that started in 2009. But time alone will not give you the sufficient information you need to identify market tops. All of the key identities must be in place at or near major market tops.
Sentiment or Investors’ Expectations will always be high at or near market tops. Extreme sentiment is always an attribute of a market turn or top but, by itself, is not a determinant of the turn. One of the key tells of a market top, is for Sentiment to change dramatically just after a price high and when the technicals start to turn down.
Big market extremes are characterized by Changes in the Minds of Investors. One of the most difficult aspects of this methodology is to determine the degree or scale of the Market Sentiment or how big an extreme is being made. Often high sentiment only leads to pullbacks, but by merging the Sentiment Analysis with the Technicals, one can have a better grasp of this. Thus, if the Technicals are diverging or reversing on a daily as well as a Weekly basis, probabilities favor a more important change in the Sentiment.
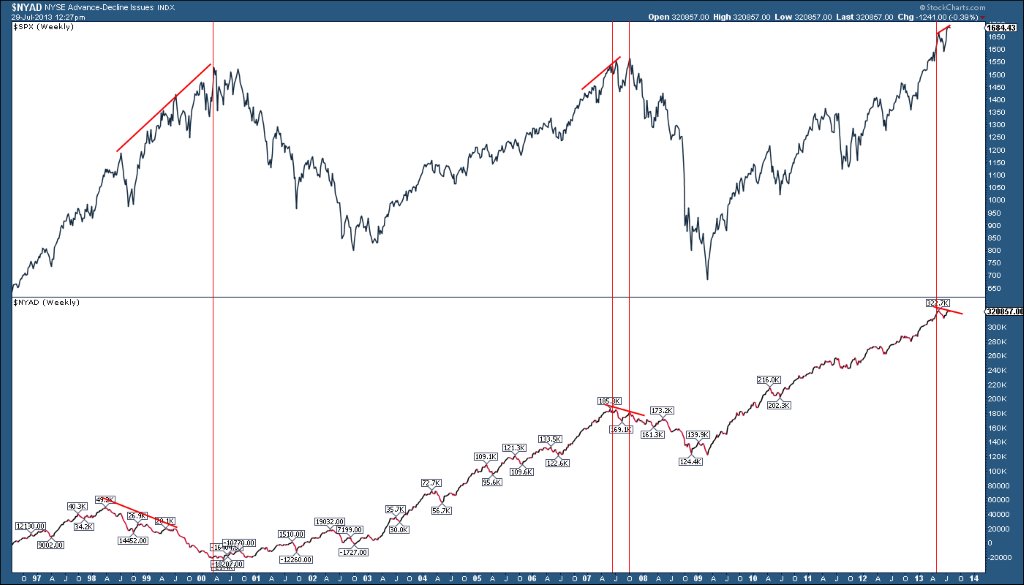
Market Breadth. There are a number of ways to monitor the market breadth, but the one thing that has always marked market tops, is a divergence between the NYAD (NYSE Advance-Decline Issues) and the SPX. A divergence is when the SPX heads to new highs as the NYAD fails to make a new high. This divergence has shown up at every market top during our 13 year time period.
The chart below illustrates these negative divergences. We have never had a true major top without this divergence.
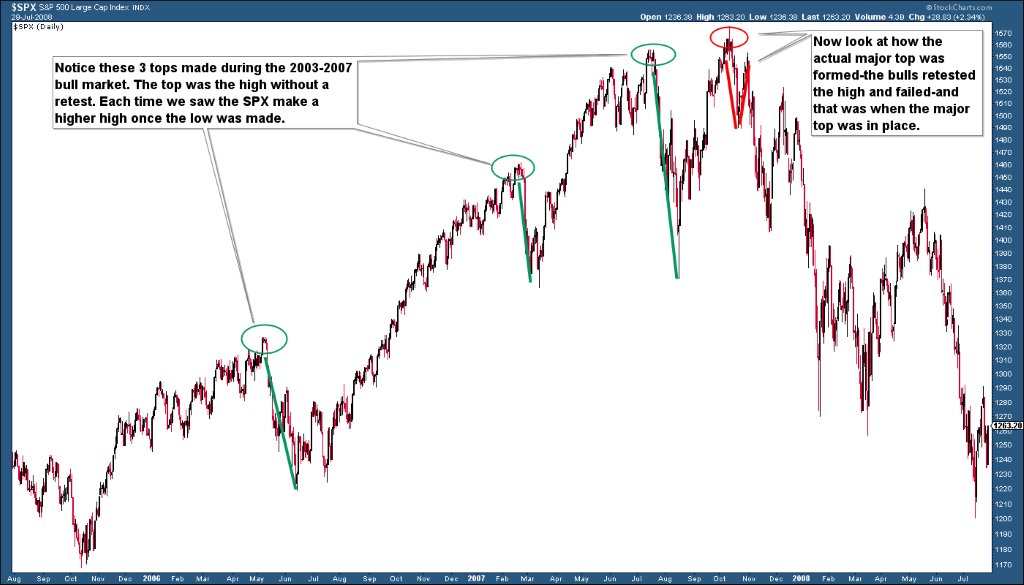
Price and Price Patterns: There are certain price patterns that typically take place at market tops. Very rarely will you see a major top form from the exact last high. Tops are a process and take time to form. Once a top is in place, you will almost always see the bulls try and test that high again. When it fails to make a new high, that is when you can consider a major top is in place. Below is a chart of the SPX and when it topped in 2007.
When looking for major tops in the markets, all of the elements above must be in place. If one is missing, you must leave the door open that the major top is not in place yet.
#####
Want to know when the next turn is coming? Get your FREE Sentiment Timing Index Chart here

