
September U.S. Treasury bond futures (US U3) have seen prices trend solidly lower for several weeks, including prices hitting a fresh contract low on Thursday. The bears are in firm command and there are no early technical clues that a market bottom is close at hand.
The Treasury bond futures market is an important “outside market” that impacts many other markets on a daily basis. This is also called Intermarket analysis. My friend and respected industry professional Louis Mendelsohn has been studying “Intermarket analysis” for decades.
From an important Intermarket analysis perspective provided by VantagePoint Intermarket Analysis software, it appears there will be more downside price action in T-Bond futures in the near term.
VantagePoint is a valuable trading tool for which a trader can glean clues on potential near-term price trend changes or continuation of present trends. These near-term clues provided by VantagePoint can and do give a trader a key edge.
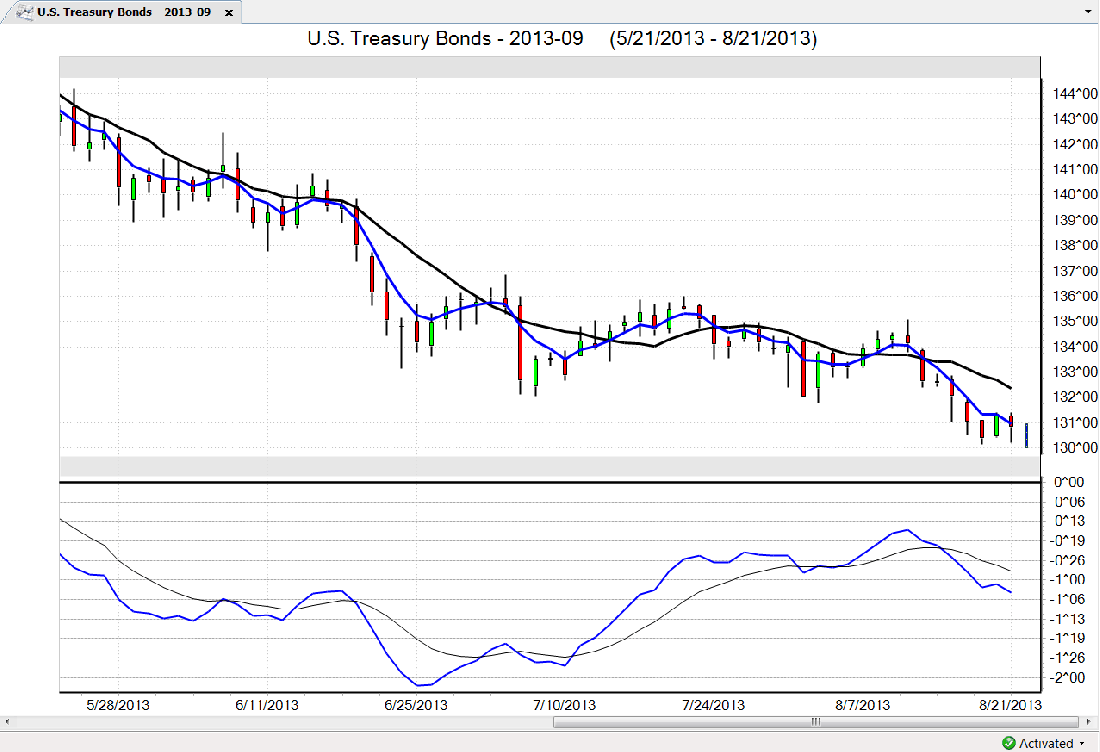
See on the VantagePoint daily bar chart for September T-Bonds that the Predicted Medium Term Crossover study shows the blue predicted 4-day exponential moving average is below the actual black 10-day simple moving average close, and both lines are trending lower, which is a near-term bearish signal.
The Predicted Medium Term Crossover is the predicted 4-day exponential moving average of typical prices four days ahead (P4EMA+2) crosses above or below the actual 10-day simple moving average close (A10SMA).
Also see at the bottom of the daily chart for September Treasury bond futures that VantagePoint’s Predicted MACD (PMACD) is in a bearish posture. The PMACD is a trend-following momentum indicator calculated by subtracting a 26-day exponential moving average from a 12-day exponential moving average. MACD Trigger (Trigger) is a 9-day exponential moving average of the PMACD.
When the PMACD line crosses below its trigger line, this predicts a possible reversal of the current uptrend to a new downtrend. When the PMACD line crosses above its trigger line, this predicts a possible reversal of the current downtrend to a new uptrend. Another crossover indicator occurs when the PMACD crosses above or below the zero line.
PMACD can also be used as an overbought/oversold detector when it pulls away from its trigger, suggesting the price of the market may be due for a correction that will bring the averages back together. PMACD can also be used to spot underlying strength or weakness when its movement diverges from the movement of prices.

