Here we are at the end of August, the one month of the year where we have no holidays here in the US and the heat rises. For markets, this month marks the start of the stretch drive to the end of the year. The report card for 2013 so far grades an A, but of course we still have time left to change that. The one complaint throughout this year has been the lack of a significant pullback. Now, that may be the ideal situation for a fundamental or value strategist, but as a technical analyst what matters is the chart – and for now it’s rather constructive and showing the potential here for higher prices.
Everyone fears September and October. I get that, heck September is traditionally the worst performing market on the calendar for stocks – we started the big drop in 2008 during this month. October is the month of crashes – 1929, 1987. While the patterns are and should not be ignored, let’s be reminded we live in very different times today. I will not rationalize the current market but suffice to say there has never been a time in history where central bank intervention and liquidity have been more important to the markets and psychology. Further, market correlation continues to be at a low level, meaning stock picking prowess is being rewarded.
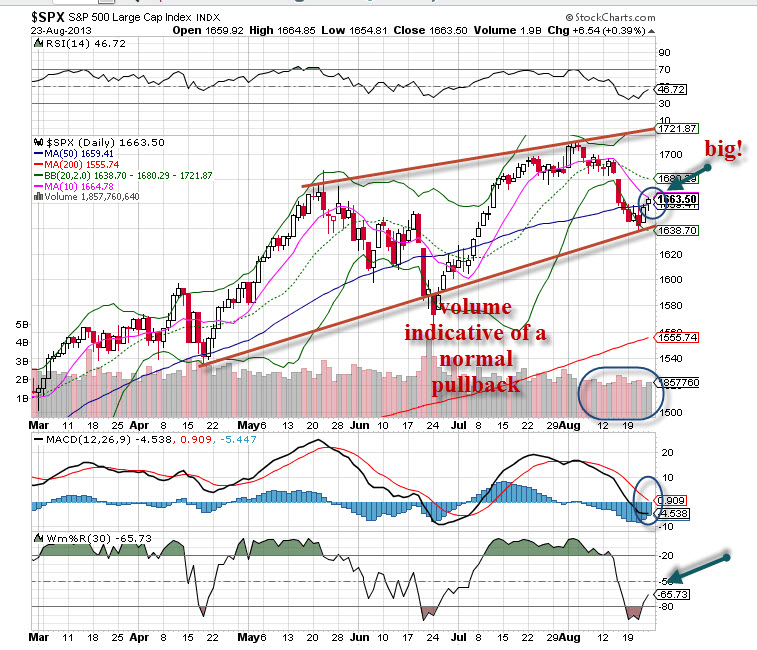
In last week’s webinar I highlighted Friday as an important day. Why was that? if you look at the chart below you’ll see why: the 50 ma. Now, as an options trader I’m not really too concerned with these longer term averages, however the trends are meaningful from a macro perspective. Simply put, institutional money can stay where it’s at and even expand further if/when the degree of comfort is high. Some will call this complacency, and that would be true.
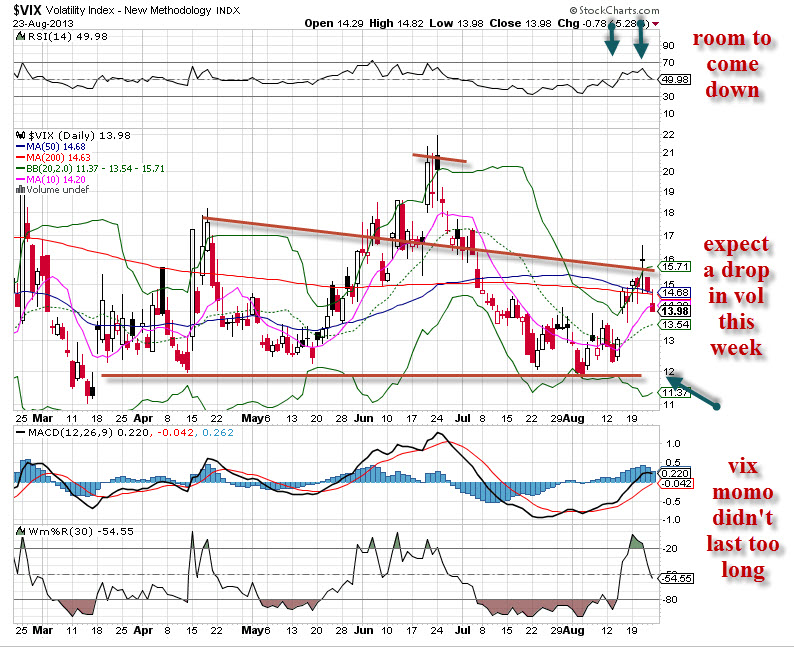
On previous tests of the 50 ma the markets moved sharply higher, and it was these trips down that put the markets in a severe oversold condition. But, market psychological has a major impact on price and movement, so we must analyze it carefully. The VIX is flashing a buy signal for the markets as we see the potential break of a head/shoulders neckline (see chart above). The move here is potentially a short one, to the 11 area until the market gets overbought again. Finally, with a holiday weekend coming we can expect a collapse in volatility to occur by week’s end.