Position traders should have gold on their radar.
At miAnalysis my focus is on ETFs, so that means GLD (SPDR Gold Trust). Last week, in response to the Fed’s decision not to reduce quantitative easing, the Dollar Index broke down from a bull channel it had been rising in since May 2011. Gold, which tends to move inversely to the greenback, hasn’t felt the benefit of that move so far. But it’s at a potential inflection point and shows a potential basing formation that would have implications for the intermediate term.
THE CHART
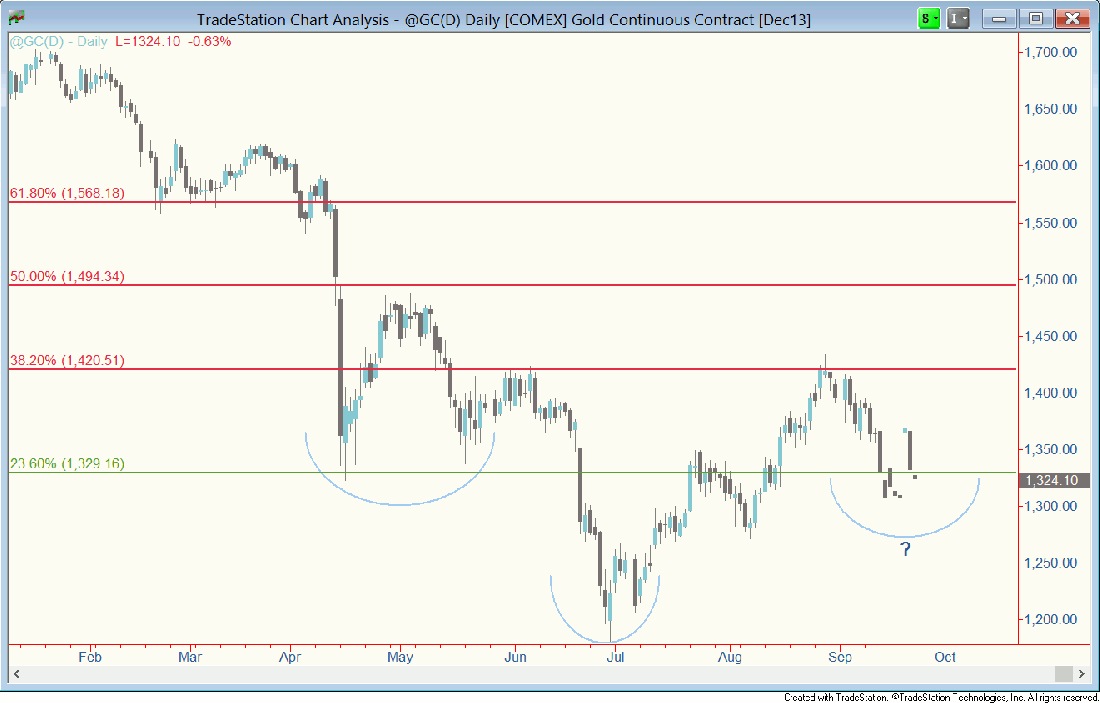
Since September 13, COMEX gold has been churning around Fibonacci support at $1329.16, which is a 23.6% retracement of the downtrend from October 2012 through this June. If price can establish a floor around this level, the reward-to-risk scenario would be attractive for long entry.

KEY LEVELS
Gold respected resistance at $1420.5 (38.2% retracement) in May-June and August. It’s early to say, but that ceiling could end up acting as the neckline to an inverse head and shoulders bottom (indicated by the arcs). In that scenario, the measured move to a breakout would be over $1660.
WATCH FOR SELLER EXHAUSTION
Keep in mind money management rules are more important than lofty forecasts based on chart patterns that may or may not pan out. The best approach is to go long if evidence of seller exhaustion appears, set a firm stop loss and stick to it if it’s met. If the market does rise, use a trailing stop.
= = =
[What do you think about gold near term? Share a comment below.]


