

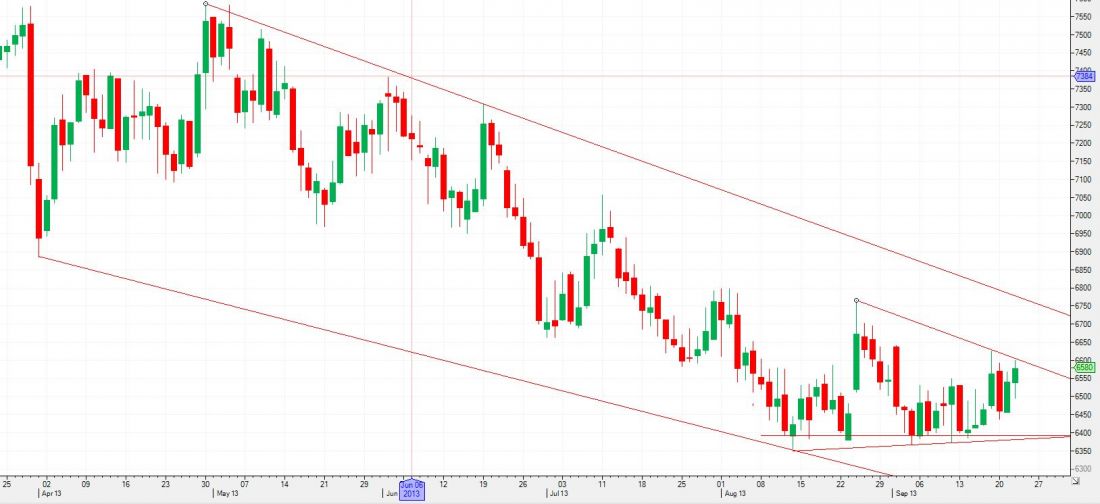
When markets develop a wedge formation on the charts, it possibly reveals a larger move that could be in the making. If you look at the chart of December wheat, the market has wedged between the 6.75 level and down near 6.40.
THE FUNDAMENTALS
U.S. soft red winter wheat and hard red winter wheat inventories are at six-year lows. World stocks are sitting near five-year lows. Cumulative U.S. export sales are running 8% above the five-year average. With the supply curve declining and the demand curve rising December CBOT futures have built very strong support at 6.40.
CFTC DATA
Last week, the COT report showed trend following funds are short 83,000 contracts, just 13 thousand short of an all-time record. This may lead to a large short covering rally. In the spring of 2012, these funds were short 87,000 contracts. When they began buying back their positions a $2.00 rally ensued! The high in April was 7.58. December CBOT wheat has broken down to a low of 6.40.
We have formed a near perfect head and shoulders bottom on the December contract. A rule of thumb in the charting game is when you finish a long-term break in the market and a head and shoulders formation is built , when the right shoulder is complete we break out to the upside 85% of the time.
TRADE IDEAS
I propose a short term and long term position to potentially take advantage of a breakout to the long side in wheat.
Near term one could look at buying outright calls using December options. I would propose buying the December wheat 725 call for 6.5 cents or in cash value $325.00. The risk on this trade is the price paid for the option plus commissions and fees.
For those looking for longer term exposure, I would look at buying a call spread using March 2014 options. I would propose buying the March 2014 720 call and selling the March 2014 810 call for a purchase price of 11 cents or $550.00. The risk here is the price paid for the spread plus all commissions and fees. In my view, traders should watch for a close over 670 basis December futures, for a move higher and conversely, a close under 640, sets up 620 as the next target to the downside.
= = =
I would like to also invite everybody that has an interest in the grain market to attend our free weekly grain webinar series hosted by Tim Hannagan, Walsh Trading’s senior grain analyst. They are live at Thursday at 3 pm central time. Sign up here.

