

Over the past three months, Intel (INTC) has drastically underperformed the market, a trend that continues as you extend the timeline even further. Over the past year, INTC has gained just 2.5 percent, while the S&P 500 is up 16.25 percent – as of Tuesday’s closing prices. The trend only gets worse if you take the chart out 5 or 10 years, where Intel has underperformed by 13 and 80+ percent.
But despite this severe underperformance, I believe there may be a short-term spike in the stock, allowing traders to capture on the move.
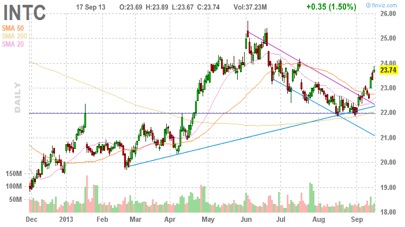
INTC recently broke out of a downward trend that saw the stock decline from above $25 per share to find support at $22 per share. Over the past month, though, the price has steadily marched higher, gaining 5.6 percent.
INTC is trading above the 50-Day Moving Average ($22.70) and above the 200-Day Moving Average ($23.12). Tradespoon’s technical indicators suggest a bullish view on INTC.
A LOOK AT FUNDAMENTALS
INTC’s short-term bullish technical indicators are also supported by strong fundamentals. Intel has demonstrated a pattern of bullish technical signs, strong annual earnings growth and attractive valuation.
Recently, Intel reported second-quarter revenue of $12.8 billion, operating income of $2.7 billion, net income of $2.0 billion and EPS of $0.39. The company generated approximately $4.7 billion in cash from operations, paid dividends of $1.1 billion, and used $550 million to repurchase 23 million shares of stock. Revenue in its PC Client Group was $8.1 billion, up 1.4 percent sequentially and down 7.5 percent year-over-year. Data Center Group revenue was $2.7 billion, up 6.1 percent sequentially and flat YoY.
Intel trades at 12.91 times trailing earnings, below the industry average of 50.12 and below the S&P 500 average of 18.59. INTC also trades below the 15 multiple that we use to indicate an impending move. Intel’s current Price/Sales of 2.23 is below the average of its industry, of 12.38. Intel is also currently trading below its intrinsic value of $29.86, suggesting that the stock is undervalued at these levels. Intel is also less volatile than the S&P 500, with a beta of 0.84.
INTC’s current price levels are at the preferable level, 9 percent below the 52-week high of $25.98 and the technical indicators are bullish.
OPTIONS PLAY
Though a majority of analysts rate INTC a “hold,” we find the technical and fundamental indicators show short-term bullish signals. We recommend the following debit call spread – buy a November 2013 $24 call and sell the $25 call for a net debit of $0.35. We believe by expiration or before that the price could reach $0.80 – offering a 130 percent return. That would correspond to a price of $24.80 at expiration. Similarly, the break-even point is $24.35 – and the trade loses money (up to the $0.35 per share) if INTC trades below that.

