

Price action tells us where the trade has been and the probabilities of where it might be headed.
However, price action alone can miss important clues about the strength or support behind the move. Volume, as the term implies, measures the number of the contracts associated with the price action, it tells us about the players on either side of the trade.
OPPOSING TEAMS
Visualize the bulls and bears on opposing teams with the bulls pushing through resistance and the bears breaking down supports, and we can now intuit how volume adds to our understanding of the resolve of those behind the action.
Volume can either provide confirmation for price action or it can raise warning flags that contradict what price action indicates alone. A consolidation base is what a trading vehicle forms during non-trending periods while it waits for a catalyst to continue or reverse the prior trend. Momentum traders are familiar with such patterns as the cup and handle, pennants, and flat bases.
The idea is a breakout of the trading base provides a green light to traders that a new trend has begun. Ideally, a breakout is confirmed by an accompanying spike in volume that demonstrates the bulls have overtaken the bears’ line in the sand, the pattern’s top-side resistance. A breakout not confirmed by volume may be a warning that while the opposing bears’ resolve has declined to give the bulls some way, others are not so convinced and their hesitation may be worth noting. High volume is associated with the entrance of smart money, those with enough capital to truly support a move. In recent weeks, traders can attest to trends that have stalled just past the starting gate.
THE VOLUME STORY BEHIND FORD
Below are three charts of Ford Motor Co. (F).
- Figure 1, taken December 19, 2012, depicted volume confirming an early base breakout.
- Figure 2, taken January 14, 2013, shows volume rise after the breakout to confirm the new uptrend, but later in the trend, a doji (candle reversal pattern) accompanied by elevated volume offers a warning that the bulls may soon be tiring. Ford would not exceed the January highs until May.
- Finally, Figure 3, taken this October looks back at Ford’s journey and where it is today. This last chart shows Ford’s last breakout this September followed by the bears pushing back (red candle/red volume), likewise, in elevated volume. The bears during the September breakout attempt would not be so easily overtaken. For now, a new uptrend is denied and Ford bulls will have to wait.
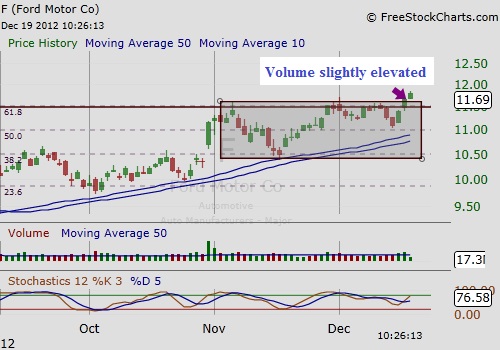
Figure 1: Ford breaks out in volume just slightly above the volume’s 50 day moving average. Chart courtesy of FreeStockCharts.com
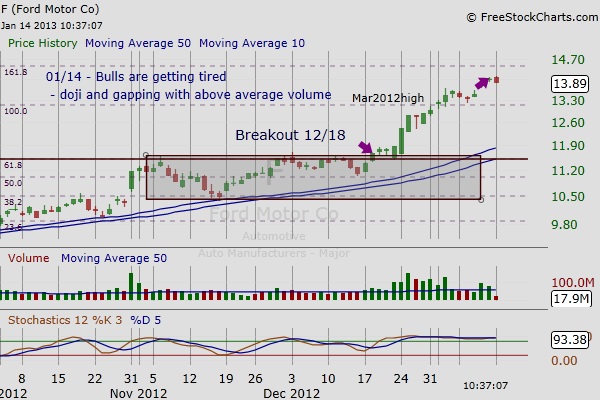
Figure 2, Doji (green candle on 01/13 with small body) is a common reversal pattern, signaling indecision and waning commitment. The accompanying elevated volume highlights this indecision. Ford would not exceed January highs until May. Chart courtesy of FreeStockCharts.com
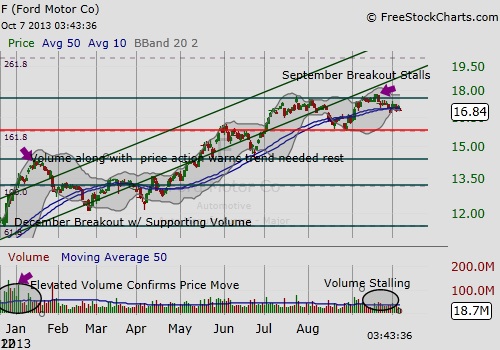
Figure 3, Ford’s journey over the last year. September breakout stalls after the bears immediately push back in equal volume, depleting at least for now the bulls resolve. Chart courtesy of FreeStockCharts.com
ADD NEW PERSPECTIVE TO YOUR CHART READING
Volume adds dimension to price action. Price action can tell us the overall trend, but volume offers insight to the commitment of the players behind the trend and price action, and can warn when their commitment or sentiment is changing.

