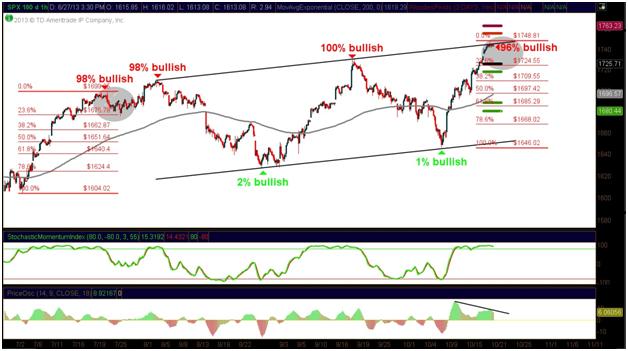
The stock market is made up of emotions. From many of the emotional/sentiment extremes, patterns form with price. When sentiment reached 100% bullish, the SPX reached the top of what I was looking at, as an ascending triangle. The pattern looked correct until sentiment reached 1% bullish on October 9. That marked the bottom for the SPX and it has rallied some 100 points off of that low.
From where the SPX bottomed, the pattern has changed. What was in play (ascending triangle) is no longer the pattern, since it broke that lower support line and has rallied back above the previous highs. Sentiment has rallied just as hard as the price and we are now seeing a 96% bullish sentiment score. There is still a little more room to push sentiment into extremes, but we are nearing that level.
The pattern that now has the top spot is an up trending channel. It could be viewed as a bearish bear flag, but I will let the market determine that. What we do know right here and now, sentiment is at levels where some type of pull back would be warranted. The pattern also supports that view, as the SPX is at the top of the channel as well.

If the SPX was going to just follow the channel in place, the downside target would be around the 1655 area. But being the bulls are in full control, I wouldn’t set downside targets that low for now. Looking for a 20-35 point pull back to some Fibonacci support is more likely. If momentum picks up on the downside, simply adjust your trades.
Taking a shorter term outlook has been the key to success for this market. I don’t think that will change right now.


