

According to the Wall St. conventional wisdom, stock markets climb a “wall of worry” to reach new highs. That pretty much summarizes the recent movement in the S&P 500 mini futures (ES) which has gained a remarkable 120 points in 13 trading days, with traders (including us) wringing their hands and moaning all the way.
The problem is that we all know how this ends – with a run up to a new high, perhaps on a spike surge, followed by a sudden collapse and a retracement. So every new high requires a new assessment: Is this the top?
And we all want to do the same thing – stay at the party until the last possible moment, then slip out the back, Jack, just before the panic starts.
The problem is that while we know what will happen, we don’t know when. And timing is crucial. You don’t want to be a day late getting out, because when everybody rushes for the exit at once, your portfolio can get trampled. But nobody wants to be standing alone in the alley while the party rages to new heights inside.
That’s the trader’s dilemma, and while we don’t have an answer for it – nobody does – we do have some ideas about how to trade it.
The first idea is to make sure you understand which time-frame you are trying to trade. For example, for the medium-term (to the end of the year, say) we are bullish on the S&P.
We think the Fed has no option but to continue (and perhaps expand) the Quantitative Easing program. And as long as the Fed keeps pouring money in, the market will continueto go up.
So if you are thinking about where we will be at year’s end, you should be watching for a retracement as a buying opportunity.
But the short term is different. The short-term indicators are extremely overbought. ES is already 290 points above last year’s high (and has never moved below last year’s close). There are major long-term resistance levels ahead of the current price. And the most recent trading is not encouraging. Trading yesterday (Oct. 28) closed near the overnight high on the strength of Apple’s earnings, but the trading range was very narrow, and the volume was the lowest since July 15.
We’re still in there, because we think the final run in the ES will reach 1770-80. But we’re worried.
Here’s the daily chart of the run-up.
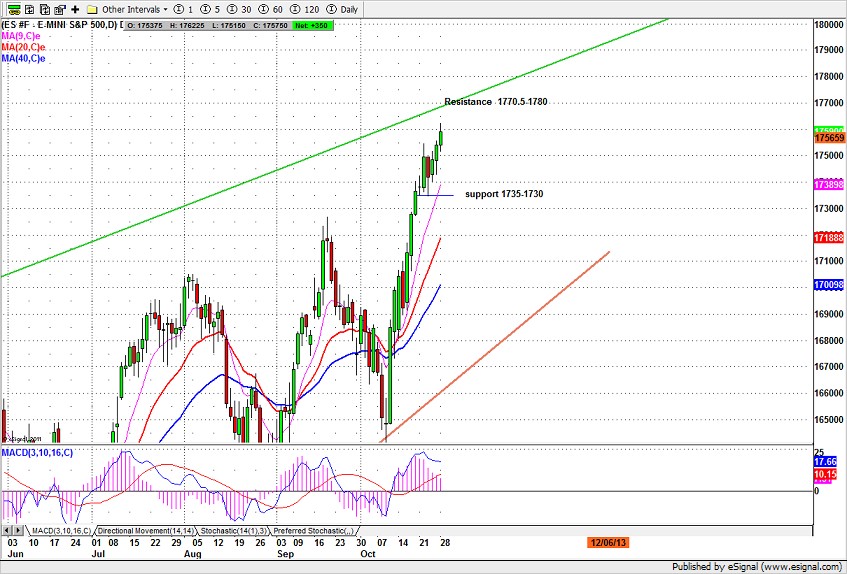
Chart: ES current contract, to Oct. 28, 2013
= = =

