Last August, I wrote an article here on TraderPlanet explaining what the yearly pivot points suggested for the S&P in 2013.
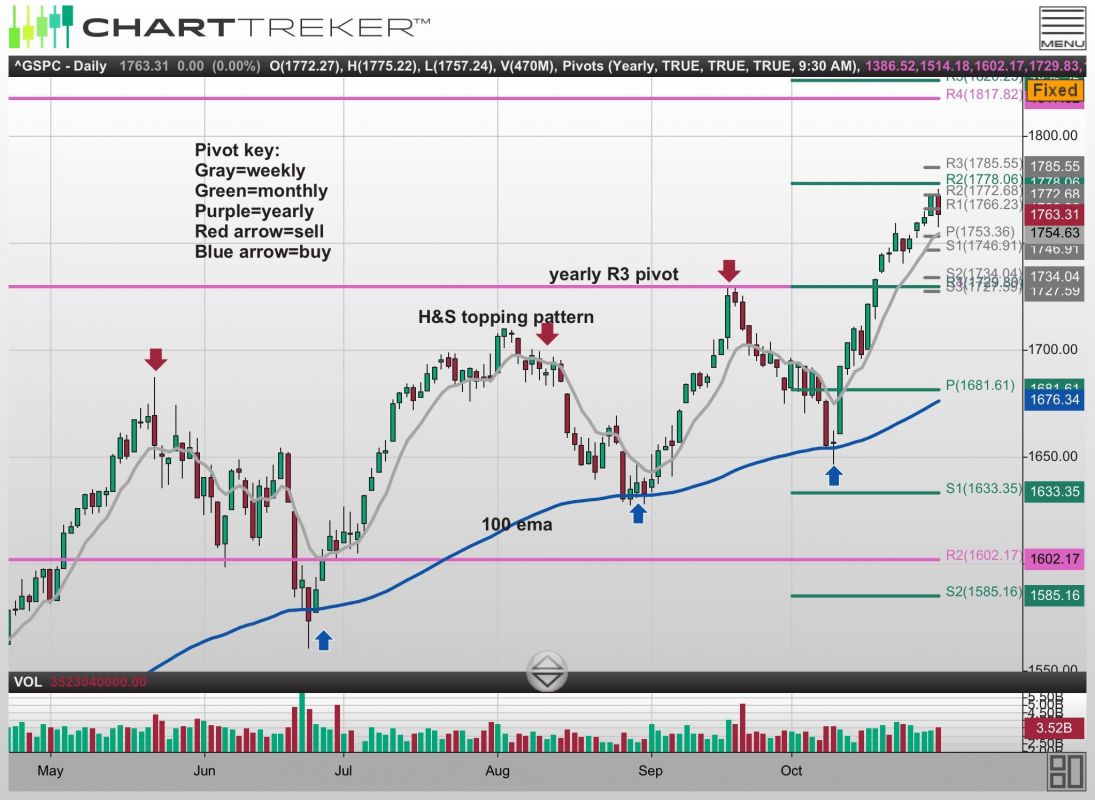
In that article I wrote “the next level of strong resistance would be at the yearly R3 pivot point at 1730.” The S&P nailed 1730 in mid September and then fell 90 points (1,000 pts on the Dow) down to the 100 day moving average( see Figure 1 below). How did I know that 1730 would be strong resistance?
It was simple pivot point analysis. The R3 pivot has an 86% chance of holding on the first test of it. Pivot points give me a precise number to trade off of, unlike Pocket pivots, Elliott wave or cycles, which are all very subjective, in my opinion. Since market makers, Algos, HFT’s and pro traders use pivots points, you should too! Now that the S&P has broken above the yearly R3 pivot (1730), the next level of strong resistance will be at the yearly R4 pivot point at 1818. Since 1970, the S&P has gone up to the yearly R4 pivot only 4x times. 3 of the 4 times it was the high for the year (1980, 1987, 1989).
HOW TO TRADE IT
We should get pullback in the next week or so to retest old resistance (Yearly R3 pivot at 1730). It should make a good buying opportunity to go long the $SPY or $ES futures and ride it up to the Yearly R4 pivot at 1818. I use a 2-3 point stop loss on ES futures. I don’t trade SPY.
= = =