

The S&P 500 futures are on a remarkable run—up about 160 points from the low at 1640 on October 9. Up almost 65 points in just the last seven trading days and within one tick of a target – 1800 – that just a few weeks ago was seen as barely possible for the end of the year. Boom!
So what happens next?
Two weeks ago we warned investors (but not short-term traders) to forgo the limited gains remaining on the upside and protect themselves against the risk of a large loss if the market slips.
We still think that was sound advice, but it is clear the market wasn’t paying attention. Now we feel like a voice in the wilderness, warning of future ruin while the party rages round us.
But we are sticking to our previous call: long-term we are bullish; but short-term we are expecting at least a small correction.
LONG-TERM BULLS, SHORT-TERM BEARS
In technical terms the S&P 500 index is in a Wave 3 expansion. For the longer term – for investors, not traders – Wave 3 is an impulse movement; it will go further than most people expect. That’s why we are intermediate-term bulls.
For the short-term, we are bearish. We see the futures market – the e-minis (ES) – at an important resistance level around 1800, which is both a psychological barrier and the top of a long-term up-trend lasting more than two years.
We think the ES will cross that barrier, but not without a fight, and not without at least a small retracement.
HOW TO TRADE IT
The market has moved past a sideways range from approximately 1735 to 1775. The top of that range, the previous resistance around 1775, has now become an important support level. As long as that support holds, the up-trend will continue.
But for the very short term, we are an over-bought condition and a pullback from the first test of the 1800 resistance line. The pullback formed a bearish engulfing pattern and stopped at 1784.75.
If the 1784 level holds up, we expect a sideways movement to work out the overbought condition and the negative divergence between price and short-term indicators (MACD, SST and PS) before the up-trend continues.
If the 1784 support fails, the next support area is around 1770.50 and the break-out from the sideways range support line will turn into a key line. A breach of this line could lead to the formation of a bearish head-and-shoulder pattern.
We are still in the most favorable three months of the year for equities; we still have a chance to see a year-end price in the 1800-1822 range as long as 1770 level holds up.
Here’s the chart:
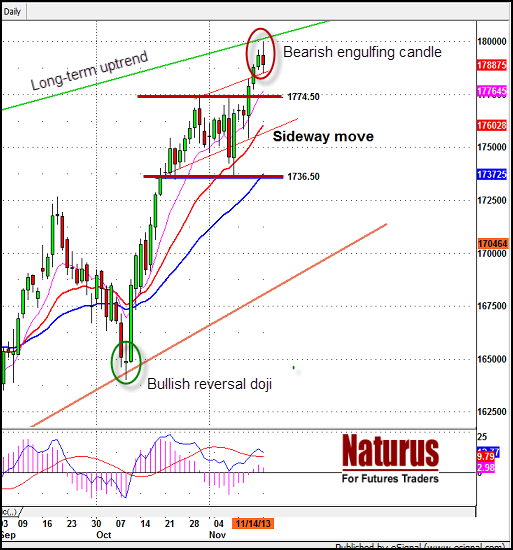
Chart: E-mini futures (ESZ3) Daily Chart
= = =
We are taking a poll: Who makes the better trader? Men or Women?
Join the conversation on our Facebook page. We’d love to hear from you.

