

There are a few ways to try and predict when a change in trend may hit. But when trying to predict market turns, one must always remember, the market is always right.
I personally like to combine sentiment-wave counts and look for fractal patterns to determine when a change in trend could hit. Sentiment remains quite high.
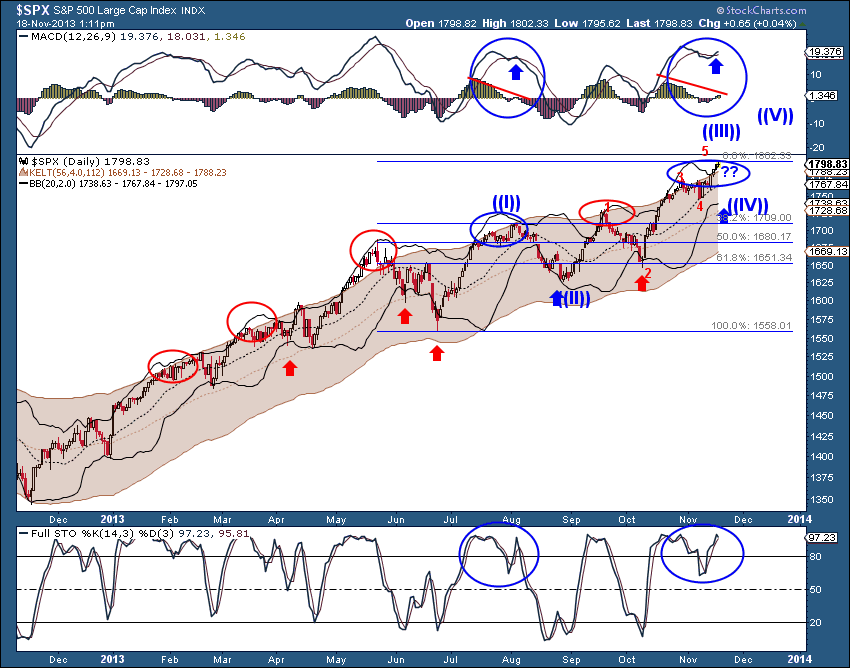
The wave count I pointed out last week, suggests that we are nearing the end of some type of wave 5 of (3), which would set up a larger wave (4) down with targets 10%+ lower. The wave count would still remain bullish, even if we get this drop.
Finally, the fractal pattern I am following also suggests that we could see at the least, a move down to the 1738-1669 level. There are a couple of things I am noticing and the first is the Bollinger bands are outside the Keltner channel. This has happened five other times and each time we saw this set up, the SPX moved to the lower Bollinger band and/or the lower Keltner channel.
The fractal pattern is marked with the blue circles and the bands crossing are the red circles. Notice the similarities of the MACD as well as the stochastics-then and now (blue circles). The fractal pattern is there, whether the market will follow it or ignore it, remains to be seen, but something worth watching.
= = =
We are taking a Facebook poll: Who makes the better trader? Men or Women?
Join the conversation on our Facebook page. We’d love to hear from you.

