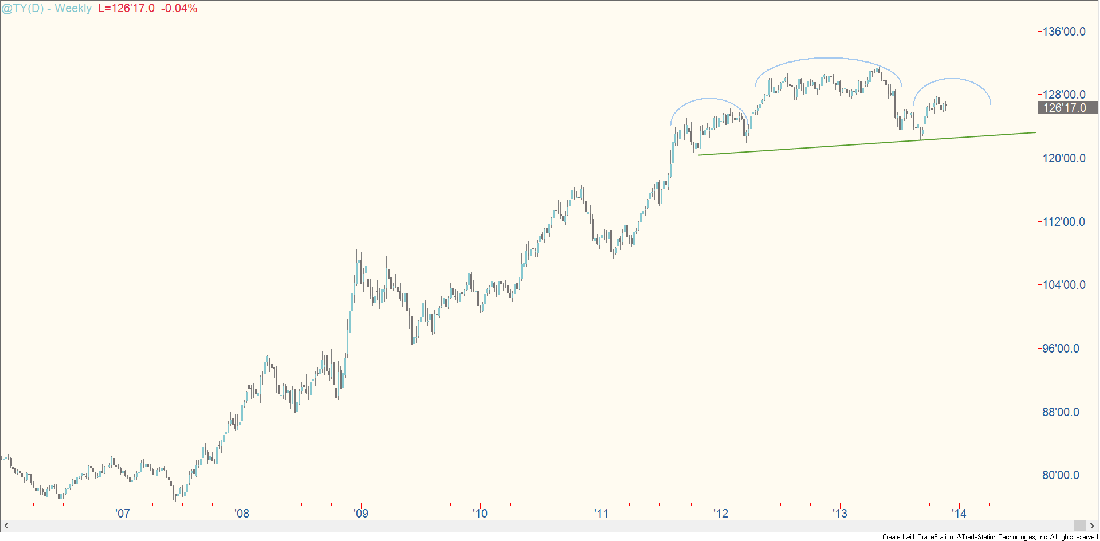
The weekly chart of the 10-year Treasury future shows what could be a substantial top that would favor losses in the intermediate or long term.
PRICING IN THE FED
This scenario would be consistent with the bond market discounting a reduction in the Fed’s monthly asset purchases, and eventually a lifting of ultra low interest rates (Treasury prices move inversely to yield).
It suggests it’s time for investors to consider reducing their bond allocation. TBT (ProShares UltraShort 20+ Year Treasury Bond Fund) could offer opportunities for position trades; however, this is not an appropriate ETF to hold for the long haul due to its make-up.
CHART PATTERN
The arcs I’ve indicated on the chart show a head and shoulders top may have started evolving in September 2011. This pattern comprises a peak encompassed by two lower highs on either side. A violation of the neckline (green line) would confirm a breakdown and favor a falling trend in the intermediate term. The neckline comes in modestly above 122 in the coming weeks and continues to rise over time.


