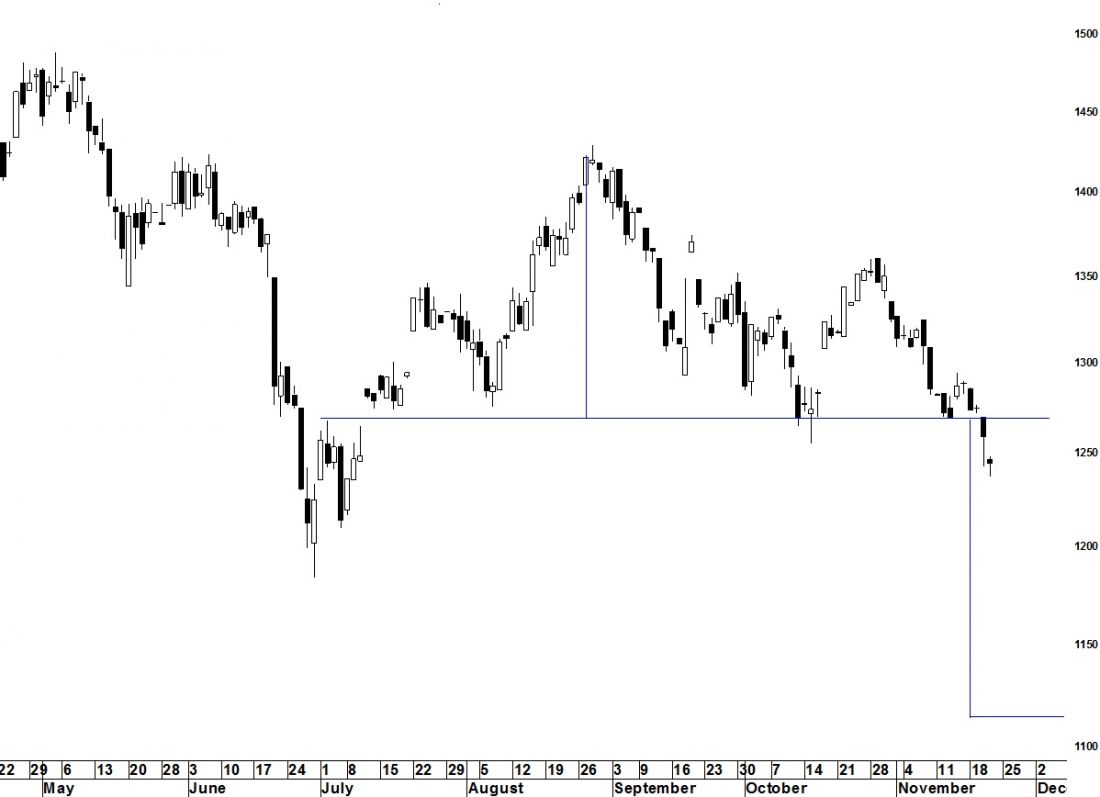
Gold bulls got another shock last week (assuming they’re still watching the ‘golden anchor’). Gold has breached the neckline of a head-and-shoulders pattern which has been five months in the making. On the chart below, readers can see the left shoulder in July, the head in August, and the right shoulder in October.
Head-and-shoulders patterns are traditionally considered reversal patterns. To be considered bearish the pattern would be expected to appear at the end of a bull trend. That is not what happened here. This head-and-shoulders pattern would be described as a continuation pattern as it served as a consolidation during the bear trend. There is a fair amount of debate over whether or not the pattern is usable as a continuation pattern. My personal experience has been that it still works.
To develop a price forecast we measure from the top of the head at 1,420 to the neckline at 1,268. The pattern then measures a minimum equivalent move below the neckline. That process forecasts a low no higher than 1,116.
= = =
Request your free copy of the November Special Report: Gold at Seattle Technical Advisors.