

It has been a dreadful year for Gold Bugs. In fact it has been two dreadful years. Consider: in October, 2008, gold futures were trading at $680 per ounce; in October 2011 they traded at a high just below $2,000; and in October 2013, they were trading at $1250 – and down more than $500 in the last 12 months alone.
(They closed last Friday, November 22, at $1244).
Small wonder then that we see even the most aggressive Gold Bugs – those who are left – heading for the exits. The most recent desertion is the self-made billionaire money manager John Paulson, who a year ago was calling gold his best long-term investment, and now is said to be allowing options to expire, with his PFR Gold Fund down 63% for the year. Other prominent gold bulls like George Soros and John Loeb bailed out over the summer.
CAPITULATION?
It sounds a lot like the biggest bettors on gold are walking away, and nobody else is stepping up to replace them. The die-hard buyers are picking up their marbles and getting out while they can.
The markets call this “capitulation” and it is the last stage in a bear (or a bull) market before a blow-out spike (up or down) that marks the end of one trend and the beginning of the next.
So the conventional sentiment on gold is overwhelmingly bearish. Maybe it is time to get long?
PROBABLY NOT JUST YET, BUT SOON
We’ve been bearish on gold for the whole year, except for short-term counter-trend trades.
For example in August we warned our members – and readers here– not to short gold after it bounced off the June low. The short trade was overcrowded and we (correctly) suspected a short squeeze was coming. (It subsequently moved more than $100 against the shorts).
Something similar is at work now. When everybody has the same idea, it is usually wrong. Gold has been declining since it hit $1923.70 in 2011. And nothing goes up – or down – forever.
There are other considerations that make us cautious here:
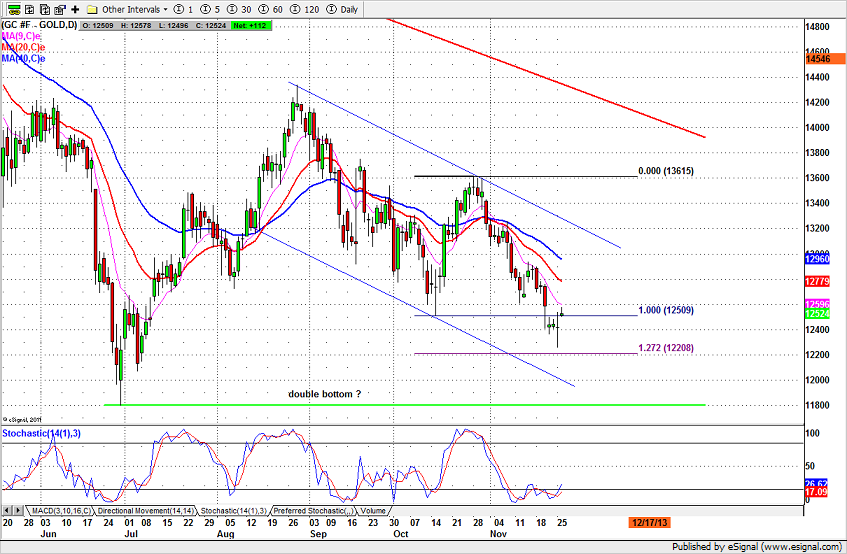
• Elliot Wave analysis suggests we could be in the final wave, wave 5, of this price movement, if we assume that June’s low is the low of wave 3. The shorts – long, intermediate and short term wave shorts – will be looking to cover at or near the low area of wave 3, or around $1160 – $1180.
• The bearish symmetrical pattern move from the August high at $1434 gives us a predicted final target around $1178 – less than $50 away, and right in line with the Elliott Wave analysis. We could form a double bottom, and that will induce the pattern traders to cover existing shorts and avoid instituting new ones.
• It’s getting close to the end of the year. It is difficult to see traders initiating aggressive new positions and holding them through the year-end. We think they are more likely to rest on their oars until after the holidays.
None of this is quite enough to make us want to go long. But just like the squeeze on the August bounce, it is enough to make us stay away from the short side … for now.
But for our next swing trade in gold, we’ll be looking for a capitulation blowout that will offer a nice entry on the long side.
Chart: Gold Futures, daily chart
= = =
Learn more about Naturus, a subscription service for futures traders, here.

