
Trade Review
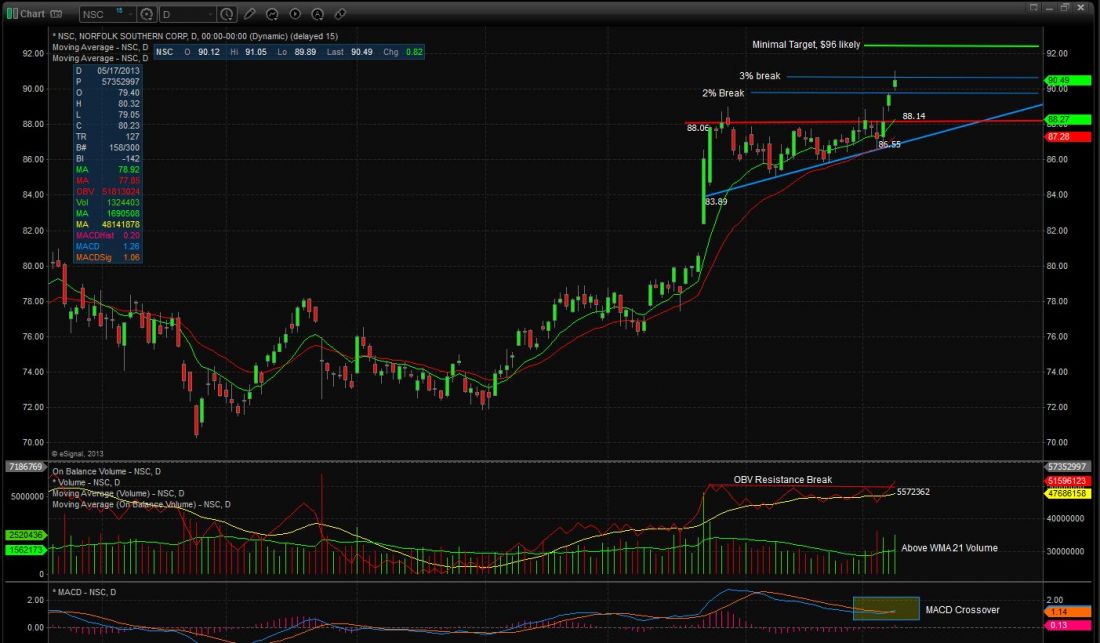
This pattern forming on the charts was an excellent example of a fractal! Click the link HERE to see the NSC annotated Weekly chart that I will be referencing. Here we have an ascending triangle on the daily chart, and if we remove ourselves one time frame to the weekly chart we see a flag (high & tight) or perhaps we call it a pennant. Either way, it is our ascending triangle in a condensed version. We hit the 2% breakout mark, and touched but failed to close above our 3% breakout mark. On the daily, OBV is breaking out of the range, and on a weekly frame we are seeing the OBV hold it’s uptrend. This combination and the MACD signaling BUY on the daily chart is all very bullish, confirmed by above average volume. Determining where our target should be is difficult because of the huge bullish move before the pennant formed on the daily chart. Here, we took a conservative approach and set our MINIMUM price target to $92, but I am expecting a move to the $96+ region if the market fundamentals hold up. IYT has me a bit skeptical, but that’s an entirely different story, and it really doesn’t look that bad. All being said, we took the MAR ’14 87.50 C but obviously you want to go with whatever option you feel gives this play enough time to workout and the lowest BEP. I got in this move Friday before the close so my option pricing varied. Getting in now may be chasing, so consider waiting for a pullback to the breakout point or the trend line moving upward from the pattern’s base as another good entry.
- 2% Breakout Exceeded
- Nearing 3% Breakout
- Above Average Confirming Breakout
- Fractal Pattern
- New 52W Highs
- New All Time Highs
- OBV Breakout Daily / Weekly OBV Holding Trend
- Market Fundamentals Remain / IYT Positive Trend

