
For the Monday of the pre-Christmas, almost-one-week-away period, the market appears to be behaving quite erratically, but is it? The media is attributing the strong opening to something or other about the FMOC meeting tomorrow. What else is there to say?
- U.S. nonfarm productivity rose the most in nearly four years in the third quarter but a drop in unit labor costs underlined a lack of inflation pressure, bolstering arguments for the U.S. Federal Reserve to maintain its massive monetary stimulus.
There you go. US productivity rises, inflation remains in check, and the conclusion to draw from this is the market is up because it suggests the Fed will hold off on tapering. Maybe so, but there are other factors as well that suggest reasons for the market’s strong opening.
- The Federal Reserve reported that U.S. Industrial Production for the month of November was reported at +1.1%, which was above the consensus expectations for +0.5% and above last month’s reading of +0.1%.
- The nation’s factories reported that Capacity Utilization came in at 79.0%, which was above the expectations for a reading of 78.4% and last month’s reading of 78.2%.
Yes, the upbeat economic data from the US could be a reason for the market’s surge this morning. As well, the news from across the Pacific could be meaningful. After all, Japan is the third largest economy.
- Business sentiment among big manufacturers in Japan rose to its highest level in six years in the three months to December.
- “Things are getting better in Japan. It doesn’t matter whether it’s at the capex [capital expenditure] level or consumer sentiment [levels]. You see it in so many sectors, not just big end consumption like increased golf club memberships, but at the low-end as well,” Nicholas Weindling, a fund manager at J.P. Morgan Asset Management says.
Across the Atlantic, the rather large European economy is continuing to show signs of increased productivity as well.
- Eurozone: 52.7 vs. consensus 51.9 (Nov: 51.6, Oct: 51.3)
- Germany: 54.2 vs. consensus 53.0 (Nov: 52.7, Oct: 51.7)
Remember that energy transformation I have been mentioning here and there. I have not written much about the wind aspect, but now I am curious because of Iowa. Yes, I said Iowa.
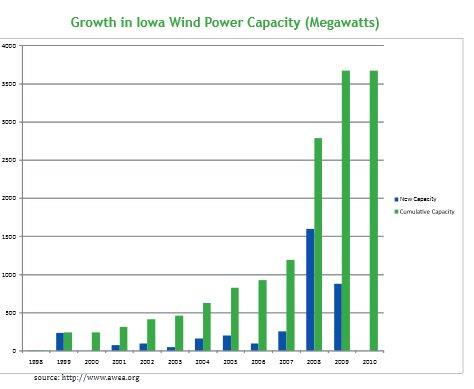
The chart above shows some serious movement in that state, which led me to wonder about what else is going on there with the wind thing, since that chart is almost four-years old. So, I checked in with the IWEA (the Iowa Wind Energy Association) to see what I could see.
- MidAmerican Energy’s recent announcement of another 1,050 MW of wind projects and the Rock Island Clean Line High Voltage DC project to carry 4,000 MW of wind energy to east coast markets will result in over 10,000 MW of installed wind energy capacity. This should occur by 2017 which is well ahead of IWEA’s goal of 10,000 MW by 2020!
The above announcement dovetails nicely with a bit of news that cane across the wires this morning. We now have a supplier for the massive project.
- Siemens won an order to supply 448 wind turbines with a total capacity of 1,050 megawatts (MW) to U.S.-based MidAmerican Energy, which the German engineering group said was the largest single order for onshore wind power ever awarded. The wind turbines, with a nominal rating of 2.3 MW each and a rotor diameter of 108 meters, are to be installed in five different projects in Iowa.
My new research task is to find any and all publically traded companies in the state of Iowa that will get a piece of the huge action. Time to go to work.
Trade in the day; Invest in your life …

