

It’s December and it’s time to look at what the 2013 has left us with.
This year started with great expectations. Everyone was expecting the global economy to recover. Politicians and policy makers were waiting for the 2013 like a child would wait for Santa Claus to appear in the living room. Well, Santa Claus did really show up; the problem is that instead of presents, he brought coal.
2013 will probably be remembered like the year in which the discrepancy between financial markets and real economy became finally evident even to the layman down the street. The unemployment rate remains very high, a lot of people in both USA and Europe are struggling with enormous amounts of debt but the S&P500 is around 1,800 points.
In the States, the stock market kept going up all year long thanks to the continuous and artificial stimulus provided by the Federal Reserve. On the other hand, the European Central Bank, in order to avoid a catastrophic domino effect caused by Greece’s economic collapse, kept buying risky peripheral sovereign debt securities. The 2013 has been a year where Central Bankers played, once again, a key role. Hence, we can effectively state that, during the 2013, we witnessed to a non–existent economic improvement.
Nevertheless, the non–natural uptrend generated in both European and American stock markets offered some interesting trading opportunities. The best trade of the 2013 involves the asset classes that became really popular back in the period 2008–2009: S&P500 and Gold futures. The next chart shows the performance of the aforementioned futures from the 2nd of January 2013 until the 10th of December 2013:
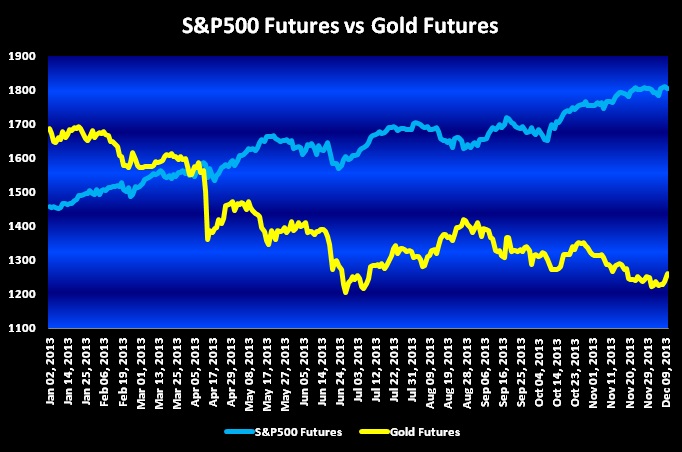
The chart is self explanatory. The American equity index experienced a steady uptrend while the futures tracking the price of the precious metal dropped significantly all year long. The inverse oscillations of the 2 asset classes look almost symmetrical, in fact, the yearly correlation between them is strongly negative (-0.80).
Gold has always been used by market players either as a hedging tool against rises in the inflation rate or as a hedging tool against sharp retracements in equity indices. Nevertheless, the drop in gold prices has to be attributed to fundamental reasons such as lower global demand and selling pressure caused by struggling central banks that diminished their gold reserves in order to increase their liquidity.
The reason the Long S&P500 / Short Gold position can be labelled as the best trade of the year is because both markets experienced large movements in opposite directions.
As we previously mentioned, the American equity index moved higher because of the intervention of the Federal Reserve. The Fed exogenous variable, that “motivated” traders and portfolio managers to keep buying, pushed S&P 500 futures from 1,460 in January to 1,805 points in the first week of December. That is a 348.15 points move which means that if a hypothetical investor had bought 1 futures contract on the 1st of January, he would have made more than $85,000 by the first week of December.
On the other hand, the gold market moved down considerably in the last months. In fact, gold futures were trading at $1,687.9 on the 2nd of January 2013 and are now oscillating around $1,260.7 which means that the price of the yellow metal lost 427.2 US dollars. Again, if a hypothetical investor had decided to sell gold futures at the beginning of January 2013, he would have made more than $40,000 so far.
Specifically, being long S&P500 futures / short Gold futures since the 2nd of January until the 10th of December would have yielded an aggregated profit of almost $130,000 ($129,757.5 to be precise). It is important to point out that our simulation is based on the purchase of one S&P500 futures contract and the sale of one Gold futures contract. Axiomatically, if the hypothetical investor had used 4 futures contract (Long S&P500 x 2 / Short Gold x 2), the investment would have gained her almost a quarter of a million dollars ($259,515). Furthermore, the American stock index has also fluctuated rather steadily because if we look at the realized volatility chart, it is easy to notice that the volatility in the equity market was overall not that high:
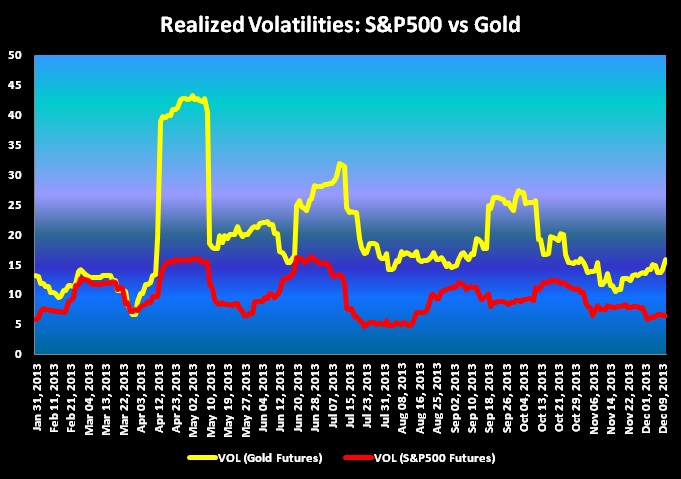
The volatility of the S&P 500 never managed to get higher than 16% while the gold market experienced 3 major movements that took, on average, 40 days to be “reabsorbed.” Nonetheless, such phenomenon is rather normal since it is notorious that commodity markets are more volatile than equity indices, hence, our hypothetical investor would have been happy to keep its short positions on for the whole year.
RELATED READING
Impact of CME Fee Increases On Retail Futures Traders by Carley Garner

