

I am always excited for the first trading day of the New Year. Why? Because I get to see the new yearly pivot points for the coming year.
For me, yearly pivot points are my crystal ball. They show me where stocks & indexes will find strong support, and where they will run into strong resistance, for the year.
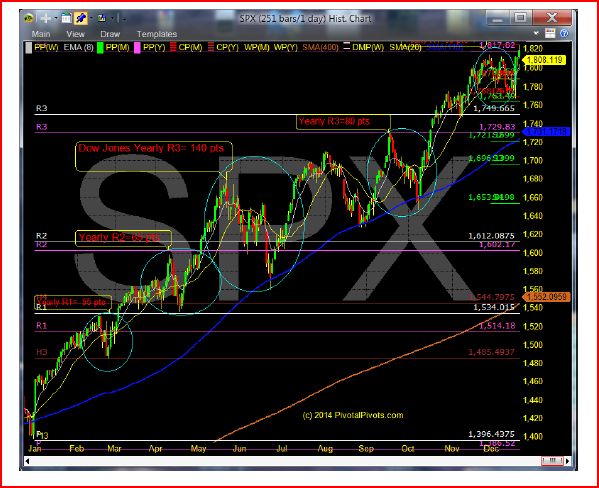
LOOKING BACK
In 2013, the low on AAPL (Apple), Backberry (BBRY), US Steel (X) and JCPenny (JCP) was on the yearly S1 pivot. The low on Gold (GC futures) was on the yearly S4 pivot. The high on Wti crude oil was at the yearly R1 pivot. On the S&P 500 index (SPX) there were 5 market pullbacks in 2013.
Four of them happened when the index hit the yearly R1, R2, R3 & R4 pivots. (See Figure 1 below). That’s why I call them “Pivotal Pivots(tm)”.
WHAT ARE THE PIVOTAL PIVOTS FOR 2014?
I am watching for strong support / resistance at these levels price levels.
S&P 500 R1=1990, P=1706, S1=1565
Dow Jones R1=17,678, P=15,486, S1=14,384
Gold P=$1363, S1=$1020, S2=$840 Silver P=$23.50, S1=$14.50
WTI Oil R1=$107, P=$97, S1=$88, S2=$77
Apple(AAPL) R1=$630, P=$507, S1=$439
= = =
WEBINAR

