

With Friday’s breakdown below 1,810 in the S&P 500 index and 16,086 in the Dow (both numbers represent the November highs which were broken in mid-December) the Lindsay forecast for a high to the2009 bull market on 12/31/13 is looking to be very likely.
In my 12/16/13 commentary (Lindsay Cycle points to a top Jan 2) I shared how a low-low-high interval was pointing to a possible top in the Dow on, or near, 1/2/14.
When forecasting the high of a bull market we look for two Middle Section forecasts pointing to roughly the same day. One Middle Section needs to be centered on the basic cycle and one on the major cycle (Long Cycle).
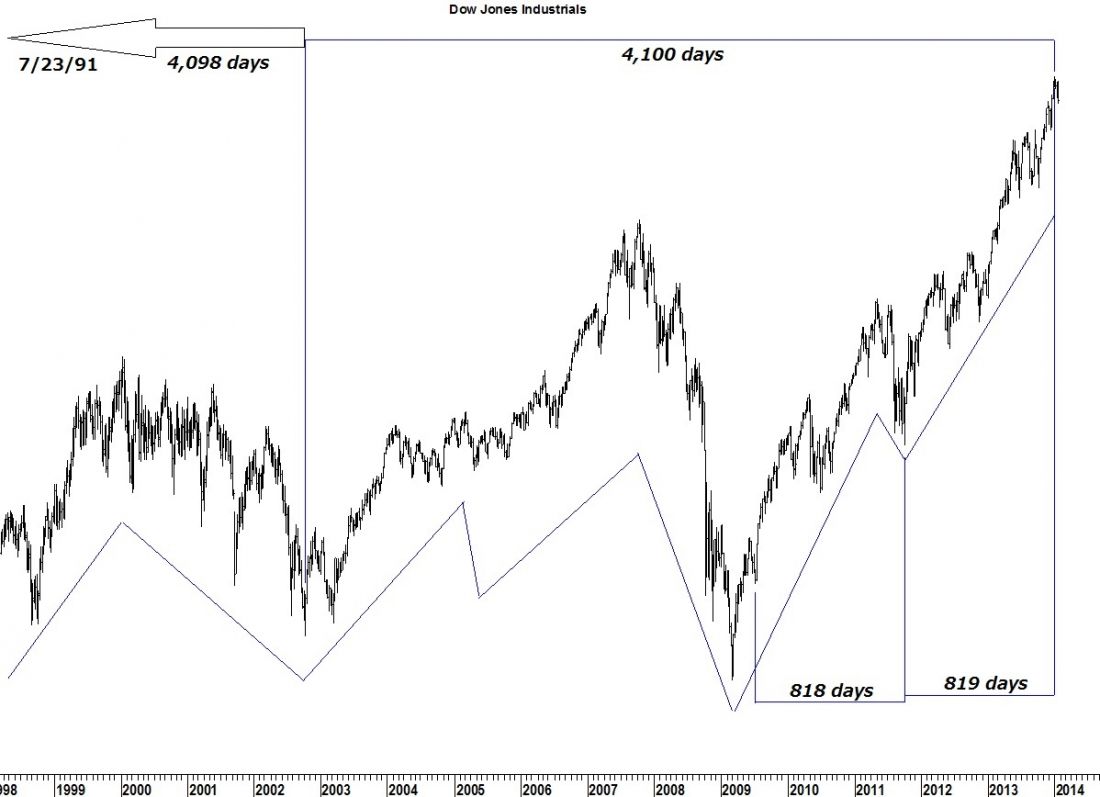
The current basic cycle began on 10/4/11. In this instance another low-low-high interval occurs and takes the place of a Middle Section count. From the low on 7/8/09 to the low of the basic cycle on 10/4/11 was 818 days. The high on 12/31/13 was 819 days later.
The low of the major cycle (Long Cycle) was on 10/10/02. 4,098 days prior to that low was the measuring point of an ascending Middle Section on 7/23/91. The high on 12/31/13was 4,100 days after 10/10/02.
A top for the bull market on 12/31/13 also fits the long term interval. Finding tops using Lindsay’s methods always begins with a 15year interval. It forecast a high in the periodfrom 9/1/13 to 8/1/14.
While the low of the current basic cycle was on 10/4/11, the beginning of the current basic advance wasn’t until 11/25/11 or possibly 12/19/11. As it turns out, using either low as the origin of the basic advance fits one of Lindsay’s standard time spans. Counting from the low on 11/25/11 to the high on 12/31/13 was 767 days – a long basic advance (742-830). Counting from 12/19/11 to 12/31/13 was 743 days and also a long basic advance.
Get your copy of the January Lindsay Report at Seattle Technical Advisors.
Read another story here:

