

Prior to last week’s trading, as the S&P 500 index was hovering near the 1845.00 region, we stated, “We reported the 1819.00 region represented near term support.
Continue to use that pivot. A close below 1819.00 could bring a move to 1780.00 rather quickly. We also are concerned that the market was running out of steam based on our proprietary counter trend reading, which reached a -70 which is considered overbought (see below for counter trend statistics).
S&P 500 HISTORICAL ANALYSIS
Below are the five most overbought markets in the S&P 500 over the last decade and how they reacted within 30 days according to our counter trend.
Jan 16 2004 was -72.28
Feb 14 2007 counter trend was -69.03
Jan 14 2010 counter tend was -74.52
Feb 2 2011 counter trend was -72.53
May 22 2012 counter trend was -74.08
Here is how the S&P 500 performed 30 days following these readings.
Jan 16 2004 +1.00
Feb 14 2007 counter trend was -3.15%
Jan 14 2010 counter tend was -5.63%
Feb 2 2011 counter trend was -2.63%
May 22 counter trend was -74.08 -5%
IN CASH
Our internal support line was currently 1780.00, on a near term basis, which on Wednesday the S&P 500 was unable to hold. At this juncture we are remaining in cash and waiting to see if we can hold our next major support level of 1,758 before getting long.
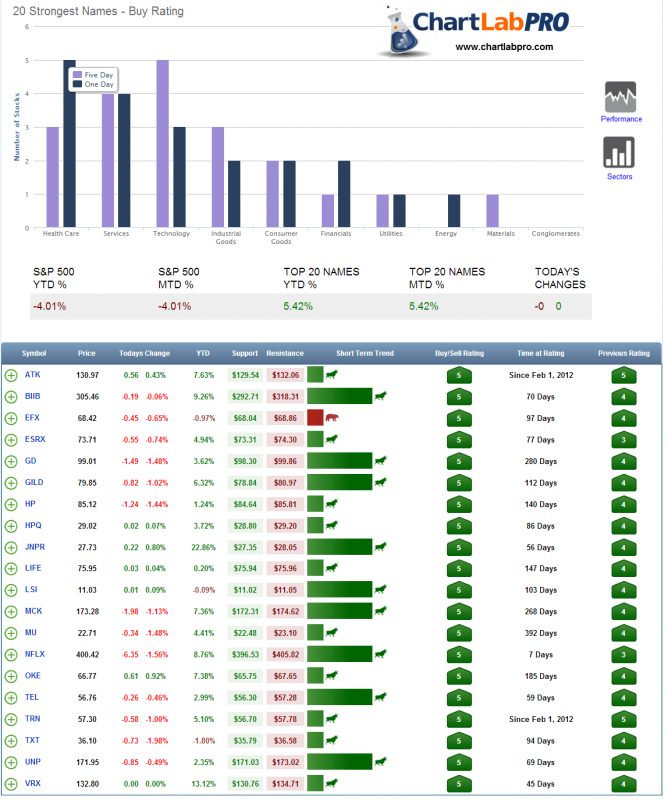
Based on our proprietary rating system, as of the close Wednesday we have provided the Strongest 20 S&P 500 stocks that you may consider if we can test and close above 1,758. These names are subject to change and with significant market erosion they may not remain within the top 20 strongest list. See Figure 1 below.
= = =
[Editor’s note: Please welcome ChartLabPro to the TraderPlanet contributor line-up. Check back each Thursday for exclusive analysis from Brett Golden of ChartLabPro. ]

