

After quite a long period of sideways action, gold and silver have broken out of their resistive containment lines and exploded into higher prices. This is a buyer’s market now, but instead of chasing price around the chart and getting in at expensive prices, it’s much better to buy on signs of weakness.
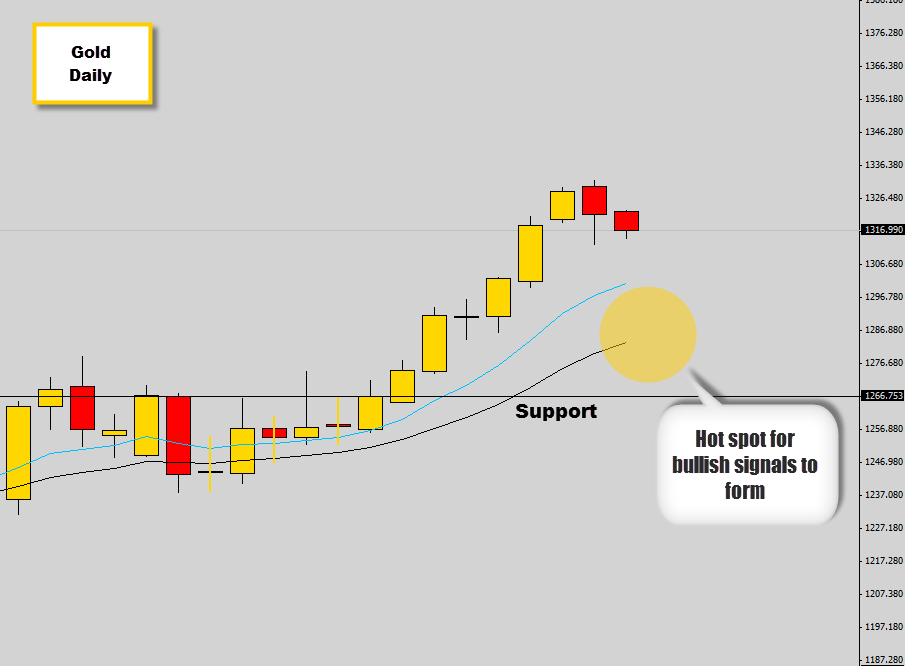
A good area on the daily chart to watch is an area where the mean value —10 and 20 exponential moving averages (EMAs) and the next key support level coincide with one another. This ‘hot spot’ makes a strong technical area to buy from.
Currently we are expecting the market to correct back the mean value, which it’s here we will be watching for a bullish price action signal to consider long positions at the much cheaper prices.

