

We’ve all heard the saying about the smart money and the, well, not smart money.
When a stock is trending up or down, it is wise to follow the smart money versus your gut feelings, news, or what your friends (the not smart money) are doing.
A LITTLE BACKGROUND
If you’re not familiar with “On Balance Volume” (OBV) let’s touch on what exactly OBV is. OBV was initially introduced to the world of technical analysis by Joseph Granville. It was one of, if not the first indicator, to measure positive and negative volume flow.
Analysts can look for divergences between OBV and price to predict price movements or use OBV to confirm price trends (following the smart money). The OBV line, as you will see below, is simply a cumulative total of positive and negative volume. When we have a close above the prior close, that period’s total is positive, and when we have a period with a close below the prior close, that period’s total would be negative. Refer to the table below on $AAPL for an example on its calculation.
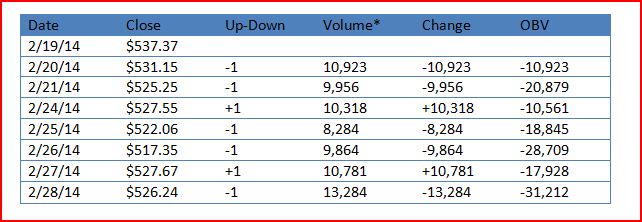
Figure 1: *Volume Shown In Thousands
Mr. Granville believed that volume would precede price. The reason for this is because typically the smart money would be taking in all the shares they could, ahead of the expected price rise, and as all that buying pressure continued, the stock would head higher.
So, how does this help your trading? That’s our main focus here, right? Well, the great thing about OBV is that it is not a standalone indicator. For starters, let me mention that as with any other trade, your price action should be your first signal, and your OBV and other indicators should confirm it. You always want as many of your stars in alignment as possible before shooting off the order. My favorite thing about OBV is that it leads price and it is subject to pattern analysis. This means that we can look for wedges, triangles, rectangle, support and resistance, etc. in helping us identify breakouts in price, before they are already on the run without us. Let’s look at some charts to help us visualize this.
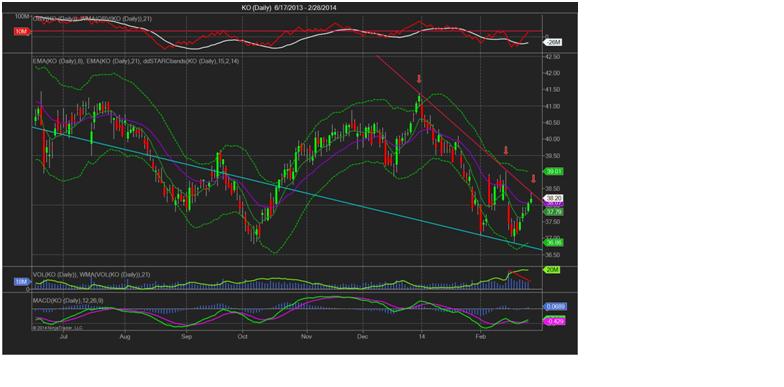
In the example above, I have my OBV plotted above my price, with a 21-Day EMA and a resistance line drawn. I prefer to use a 21-day EMA on my OBV as it helps identify trend, as well as support and resistance. In fact, this in one of the best ways to trade with OBV. If the price action supports the idea, then I find it wise to get long when OBV crosses above its EMA and short when it crosses below. In the most recent action depicted in $KO here, we have a downward trend, and the trend is our friend.
With that being said, on a cross BELOW the EMA, I may want to get short. Obviously, this tactic is not flawless, and one must consider things like price action, trend, volume, catalysts, earnings, etc. before just putting it into play. However, if analyzed, studied, and acted upon thoughtfully, this method of trading with the OBV indicator can make you a lot of money, as it has for me.
Our good friend, the $SPY has been in the news a lot lately, and has had a lot of people on edge, so let’s look at a chart of the $SPY to get an idea of how the OBV can be either a trading signal, or a broader market indicator as well.
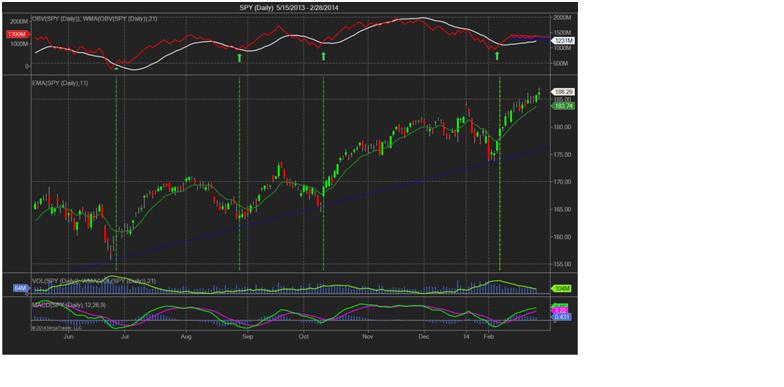
We have been in a bull market, so generally you would want to identify bullish signals, in order to trade with the trend. Here we can see the $SPY in its bull trend, as well as its pullbacks. If your trend line wasn’t enough confirmation of a chance to buy the dip, perhaps you may wait until the first MACD crossover in early July to get long. However, if you got long on the OBV cross above it’s EMA, as well as your trendline, your indicator and price action could confirm your long entry, and then perhaps we later use our MACD crossover as the final signal, and add to our position this confirmation.
In addition, if we have an idea of where we should see support and where we would expect a bounce in the market, we can also assume that the trend of the sectors and their stocks would follow, correct? With that being said, a bump off support and confirming indication from OBV, we could begin to look at individual equities and sectors that we may want to establish a long position in or dips we may want to buy. If, in theory, we identified company $XYZ approaching into a support zone, while it’s OBV is holding the moving average, crossing above, or holding a support level, we may want to buy $XYZ with the expectation of positive momentum carrying through in the $SPY, because our OBV indicates that the “smart money” is buying it up. Now, our OBV is seemingly breaking out of a tight range it had been forming while we made our way through the 1,850 level. Perhaps the smart money is stepping in and will take us higher, or perhaps, the OBV turns down here and breaks support, in which case I will be looking for our next support zone and opportunity to get long.
Best of luck, and as with any other indicator or strategy, be sure to study, practice, and due your own due diligence before heavily relying on its possible implications.

