It was a strange week for gold. The news was not good, but not bad. The tensions in Europe were reduced at least temporarily. The Fed maintained its QE taper. And Fed Chairman Yellen dropped a few broad hints about a possible increase in interest rates, perhaps as soon as the Fall. Nothing totally unexpected and nothing exciting.
But gold looked shaky, down about $65 an ounce before rallying slightly into the close.
The short-term pullback isn’t a big worry. The decline could be just a short-term overbought pullback, with a new test of the broken-resistance-now-support at $1330. We bounced from that level last week and closed a little above it.
But gold is moving toward some major decision points, perhaps not this week, but soon. And the price movements in the near future are likely to have long-term impacts, one way or the other.
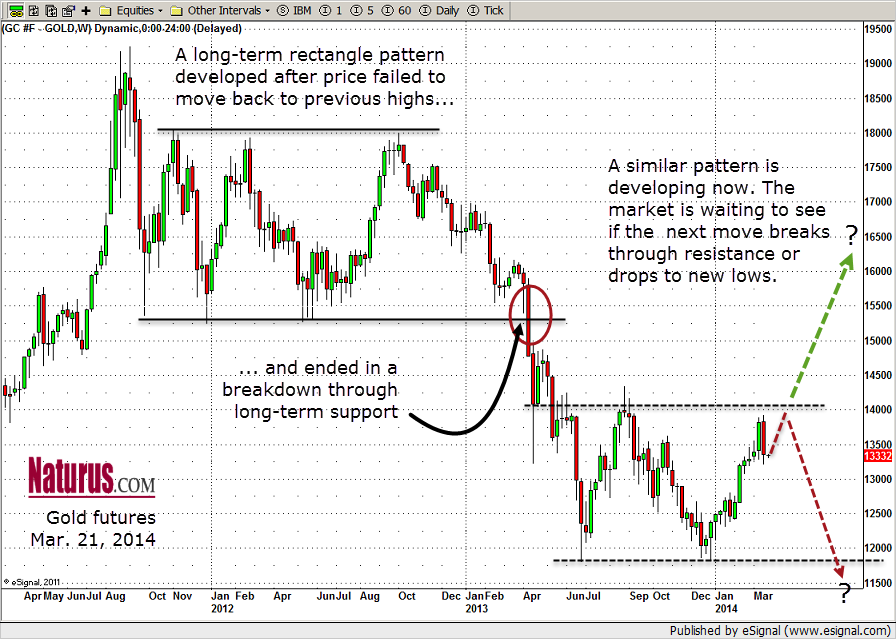
Sometime soon gold will resolve two conflicting chart patterns on the intermediate-term chart, And that resolution will determine which way the market goes next.
Basically the market will become either a double-bottom pattern, which implies an upside break-out to higher prices; or it will fall into a rectangle pattern similar to one that ran from October 2011 to Spring 2013 – and ended in a massive drop in price. (See chart).
The critical point this week is around $1376. If the futures can break through that resistance the next target is the previous intermediate-term high around $1405 – 06. If that resistance breaks, we are likely to see much higher prices.
But if we can’t move past $1376 this week or next, the price is more likely to drop back down around $1315-10, and below that to the major support at $1280.
This pattern has been developing over many months; but soon we will have a front-row seat for the unveiling of the last piece of the puzzle.