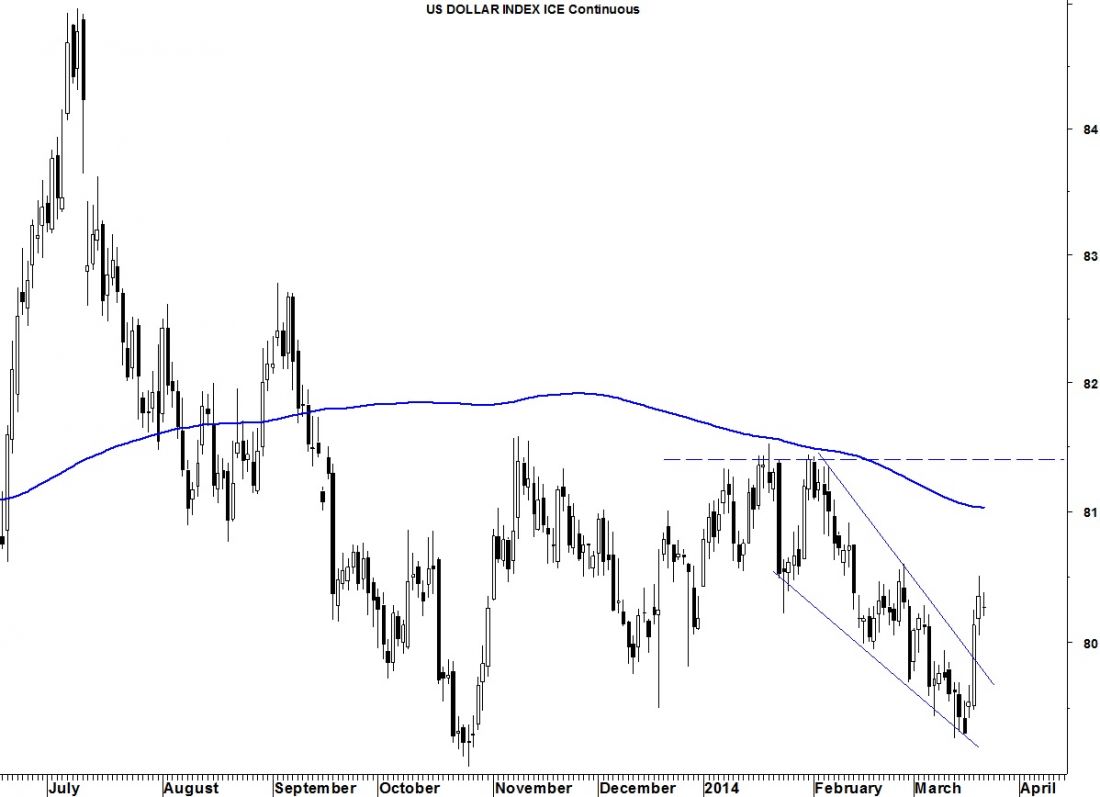
The US Dollar index bottomed on Monday’s 21-day cycle and then rallied over 1% last week (after the previous week’s big cycle convergence). In doing so it printed an engulfing bullish candlestick on the weekly chart (not shown).
DXY has formed a bullish wedge (and triggered it last week) on its daily chart below. It calls for a minimum move back to the top of the wedge near 81.40. This level has turned back advances in DXY twice since last November.
Third time’s a charm?