

Over the last couple of weeks it seems we have been experiencing some interesting moves in individual sectors. Specifically, I’ve noticed the SPDR Energy Sector ETF (XLE) chart showing an interesting setup. We have price approaching a new high, although it still is under performing the S&P since last September. The Relative Strength Index hasn’t been ‘overbought’ since last May and that only lasted one day. Momentum has slowly drifted lower as it has diverged from price.
Taking a look at volume, with the On Balance Volume Indicator, which adds the amount of shares traded on positive days and subtracts them on down days – we’ve seen a fairly large increase on this metric since February. It appears more shares are being trading on positive trading days for XLE than negative days, a bullish sign for higher prices.
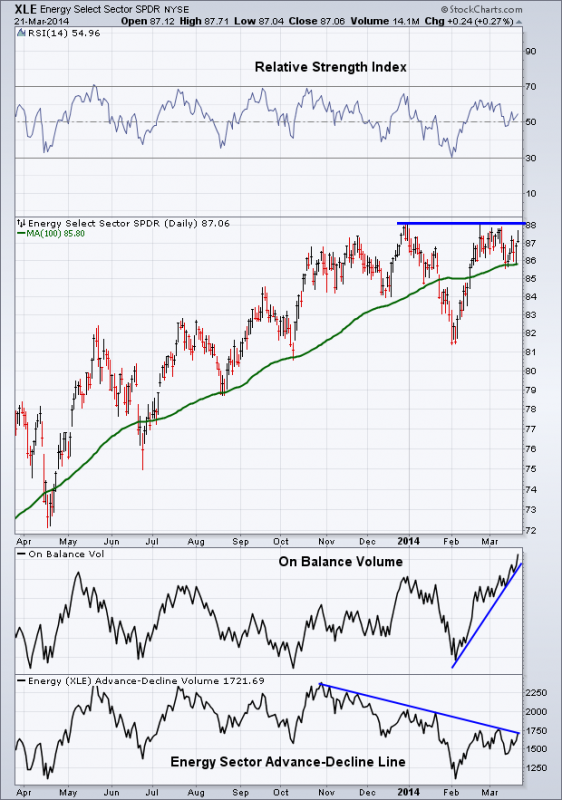
Looking at the underlying stocks that make up the energy sector in the Advance-Decline Line for XLE, I’m seeing a defined down trend from the high last October. Participation in the advance/consolidation in price for XLE has weakened considerably over the last several months, which doesn’t bode well for energy bulls.
I say this is an interesting setup because we have conflicting information. We have bullish volume over the last month but breadth for the sector in a down trend with momentum becoming stagnant as it refuses to break into ‘overbought’ status while at the same time only falling under 35 for a short period time in January. On the downside XLE has respect its 100-day Moving Average, so I’ll be watching for this to act as potential support on any further weakness.
Disclaimer: The information contained in this article should not be construed as investment advice, research, or an offer to buy or sell securities. Everything written here is meant for educational and entertainment purposes only. I or my affiliates may hold positions in securities mentioned.

