

I confess —I’m a boring trend follower.
The Primary Trend
I take a top-down approach to trend following. Identifying the direction of the broad market is the main objective. My primary indicator, my unemotional compass is J. Welles Wilder, Jr.’s Relative Strength Index or RSI.
Featured in the 1978 publication New Concepts in Technical Trading Systems, Wilder’s RSI is a momentum oscillator that measures the speed and change of price movements. RSI is measured on a scale of 0 to 100 with, traditionally, a 14 period of measure. Wilder considered RSI overbought above 70 and oversold below 30.
In my work, I use 50 as my line in the sand. Over 50, the trend is positive, below 50, negative. For the period setting, I use a weekly 14 instead of the more common daily 14. My goal is to identify an intermediate trend and ride it for weeks and months.
Keeping It Simple
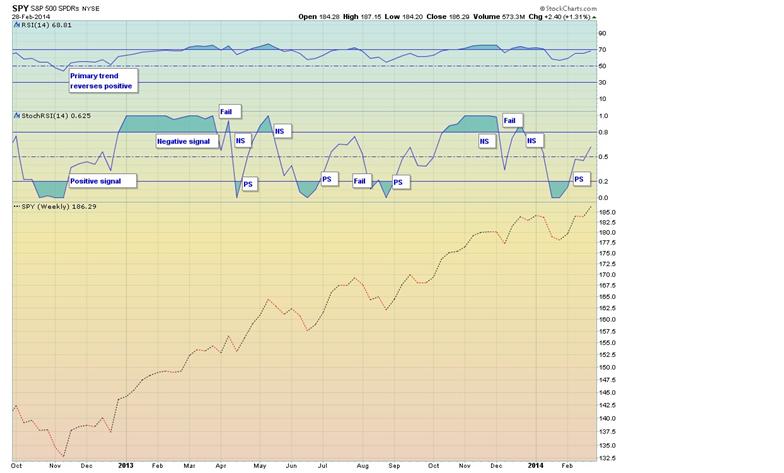
Take a look at the RSI (top indicator) on the S&P 500 SPDRs, symbol SPY, chart in Figure 1. We’ve been in a positive trend, as measured by my parameters, since November of 2012. Pretty nice run, huh? It’s not hard to look like one of the smart kids when you have accommodative monetary policy.
I’ve chosen the SPY because I track major market and sector indices. Investing through the years of the tech wreck and the financial crisis has tempered my risk tolerance. I never again want to fear the words “accounting irregularities.”
So, we’ve combined a plain vanilla investment with plain vanilla technical analysis and, since November 2012, generated some pretty impressive returns. But the 70/30 overbought and oversold parameters of RSI are too broad for my personal investing style. Could we have enhanced our returns and limited our down side?
Stochastic RSI (StochRSI)
StochRSI was developed in 1994 by Tushard Chande and Stanley Kroll and illustrated in the book The New Technical Trader. They believed they could increase the sensitivity of RSI by applying a stochastic formula to it, thereby creating a momentum oscillator that is an indicator of an indicator. StochRSI measures the level of RSI, not the level of the underlying security. It is more volatile than RSI and generates quicker signals. Values are stated between 0 and 1 with >.80 overbought and <.20 oversold.
Once again, I attempt to keep it relatively simple. When the StochRSI has fallen below .20 and then crosses above .20, a positive signal is generated. Conversely, when the indicator crosses above .80 then falls below, a negative signal is generated.
It’s time to morph from boring trend follower to trend trader and risk manager…
Trading a Trend
Let’s refer back to Figure 1 and the StochRSI portion of the chart. I’ve designated the various signals as positive or negative (as PS and NS) along with illustrating the signal failures or whipsaws.
As traders and investors, you can visualize many possibilities for practical application of the RSI /StochRSI tandem strategy. I like to share an example of investing $100,000 in a non-optionable account.
Let’s initiate a $75,000 long SPY position at $139 per share based upon the November 2012 positive RSI reversal. As a trade and hedge to our primary position, we’ll add a $25,000 position in ProShares UltraPro S&P 500 ETF, symbol UPRO, at $80, acting on the StochRSI positive signal. We don’t need to take any action until about the third week of March 2013 when we get a negative signal from StochRSI. We sell UPRO for about $116, but hold the SPY because the primary trend is positive. Remember, we’re holding our core position and enhancing/hedging with ProShares 3x S&P 500 ETFs. With our UPRO proceeds, buy SPXU, the ProShares UltraPro Short S&P 500 ETF. As seen in Figure 1, we get whipsawed quickly. The StochRSI fell below .8, then reversed back above. We liquidate our SPXU and wait for the next signal. We quickly get a drop below .8 on the StochRSI and initiate an SPXU position and so on.
I won’t bore you with each transaction, but I can say that, as of March 5, 2014 close, the SPY position was trading at $187.75 and the StochRSI component has more than tripled. Not only did we enhance our returns, but we were able to hedge our down side and identify re-entry levels quicker than just using the RSI.
StochRSI, like so many technical indicators, can be formatted to suit your specific timeframes and objectives. Study it, back test it and even trade a little with it. You might be able to add a little simplicity to your investing regimen.

