
Hello everyone! I hope you are all having an excellent start to your week today, I know I am. Today I am bringing you a trade I have personally been sitting on a bit longer, but today has broken a critical level and broken out from a pattern. It’s no doubt you saw the title and know by now that I am talking about $CORN. There’s no secret indicator or trick to this trade, just keeping an eye on your charts and following the pattern rules of your system. It’s no secret that CORN topped out in August of 2012, and since there was an excellent short as it completely fell apart. However, the tides have changed on weekly and daily charts. If you haven’t covered your short already, it’s time to do so, and consider reversing and getting long. Let’s discuss the daily chart and my trade management for CORN. The important highlights are in green.
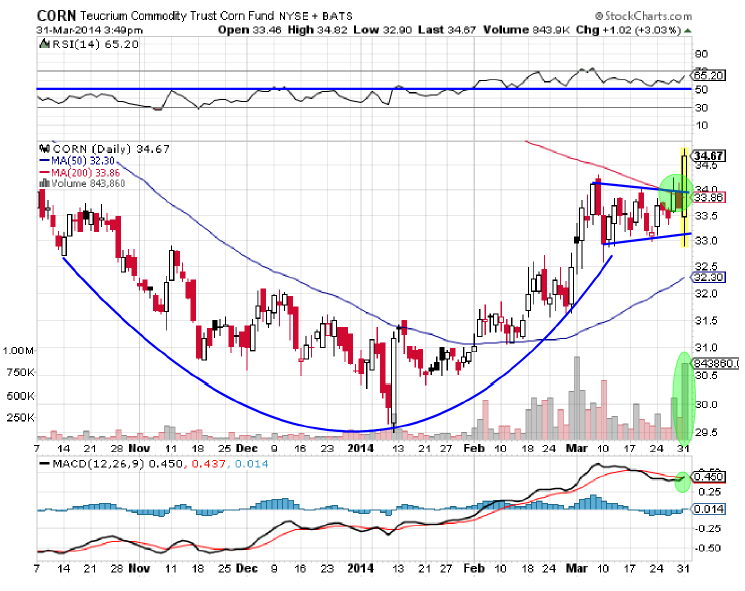
Corn created one of my favorite patterns as far as signaling a bottom, and when I recognized that I initially established a long position around $31.00 because it tested it’s 50EMA at that point and held it, as well as held above the long term down trend. Now I’m adding to that position, because of the most recent action in this chart. Looking at the chart we can see a multitude of patterns here. First, we have the rounding bottom. Second to that is the rectangle/symmetrical triangle as a stand alone, but I also classify it as the handle to the cup, so we have a cup and handle formation. We were holding above all our key averages, and flirting with the 200EMA which was the signal that I was really waiting for, because a close above the pattern would validate the cup and handle, the 200EMA break, the previously broken downtrend, and the rectangle/symmetrical triangle. If that’s not enough confirmation, looking down at the volume we can see activity has been much higher laterly, and today on this monumental break through the 200EMA and out of these patterns, we are confirmed by our volume today, as well as by the MACD lines, and today’s closing price. I’ve added to my initial position from $31.00 on this closing breakout, but this is by no means a bad spot to take up a new position. One could also take a new position or add on a pullback from the original breakout. Although normally I trade intraday and swing trade, I am holding this one on a longer term. For what it’s worth I am also using basing points as my stop, because this is a long term play. To, to sum everything up in no specific order:
- Rounding Bottom
- Broken Downtrend
- Previous Downtrend Resistance Support
- Re-Test of 50EMA Supported
- Cup Formed
- Handle Formed
- Rectangle Formed
- 200EMA Broken
- Rectangle & Cup Handle Breakout
- Volume Pickup & Confirming Breakout

