

Last week we posted a brief outlook on the broad U.S. equity market heading into the Easter holiday, and we casually dropped a throwaway line: “the markets like Easter.”
A reader asked a simple question: “Is there really a seasonal bias in favor of Easter.”
Good question. The answer is yes and no.
The bump we expected going into the Easter weekend was certainly there: the S&P 500 (SPX) was up 2.7% last week, the best performance for the year-to-date.
It is not so much that the market likes Easter as that the market likes all holidays, especially those that occur in the magic time between Halloween and May Day, when stock markets worldwide make most of their gains.
The U.S. equity markets usually have nine full-day holidays each year: New Year’s Day, Martin Luther King Jr. Day, Presidents’ Day, Good Friday, Memorial Day, Independence Day, Labor Day Thanksgiving Day, Christmas Day. (You can see the full schedule here: http://www.nyx.com/holidays-and-hours/nyse)
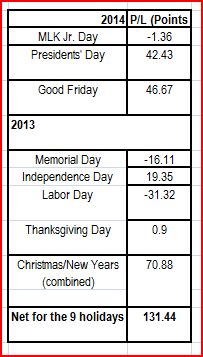
We are about half way through that list, and most of the way through the spring bump. So what has happened so far? Here are the results for the SPX in the week before the last nine full-day holidays (includes Globex):
Returns in the week preceding holidays
Looks good. But if ever there was a moment to remind yourself of the most famous of market disclaimers – “Past results do not necessarily indicate future outcomes” – it is right now. This is a small sample, and just because it happened before doesn’t mean it will happen again.
However, as writer Damon Runyon points out, “The race is not always to the swift, nor the battle to the strong … but that’s how the smart money bets.”
Get long before the long weekend
This small sample would certainly encourage you to get long any time there is a four-day week. And the odds are you would be right. According to Quantpedia.com, which cites a long list of academic studies: “Research shows that market return during pre-holiday days is often more than 10 times larger than the average return during normal trading days.” That edge that seems to hold in markets around the world.
We are suspicious of long-term studies that find cyclical patterns in the U.S. equity markets. There has been a dramatic and long-lasting change in the markets since 2008, when the Quantitative Easing programs began and essentially eliminated any substantial declines – or even regular-sized corrections.
As long as there is virtually unlimited buying power leaking into the market, many of the normal patterns of advance and decline simply don’t work the way they used to.
What we look for
Some still work; but they work differently. There are several recurring patterns we look for and sometimes trade, depending on circumstances.
One is the end-of-the-month ramp. The few days before and the few days after the end of the month – and especially the end of the quarter – tend to be up.
Another is the choppiness that usually shows up before option expiration, and the triple witching days in particular. This is less a directional bias than a period of increased volatility, when stops are likely to be hit. Often the best trading strategy is simply to watch from the sidelines and applaud those who have more courage – or money – than you.
What a difference the day makes
But there is one recurring pattern that is miles ahead of all the others. It is the fabulous returns that are available simply by being long on Tuesday.
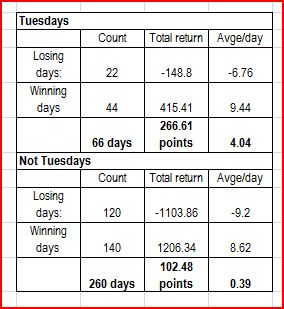
Take a look at this table. It computes the returns you gained if you simply bought the S&P 500 (or the mini-futures, which we like to trade) in the Globex pre-market and sold at the close, every Tuesday since Jan. 1, 2013, and compares it with the returns every other day of the week.
There is no other trading strategy that gives results like these: there are twice as many winners as losers, the winners are 50% bigger than the losers, and the average return is 10 times bigger than the average for all the other days of the week combined.
We don’t know what the explanation is for this. It is probably connected to the Fed’s Quantitative Easing in some way. But it is clearly not a random walk.
Similar observations can be made about bonds; The yield for the year-to-date for the five-year bond is + 15% on Tuesdays; the yield on days not called Tuesday is -25%.
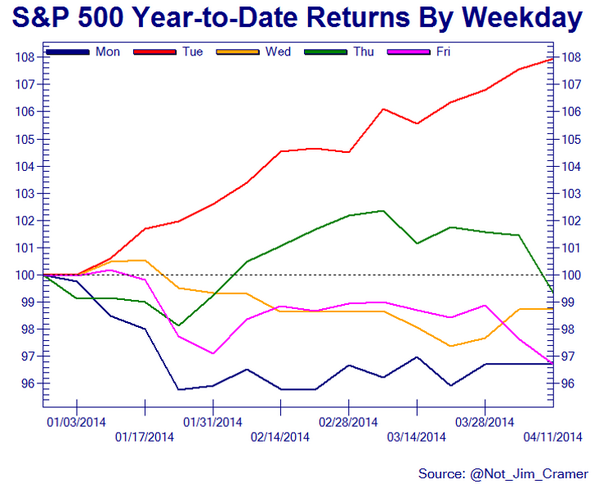
This chart from the blog @Not_Jim_Cramer summarizes the difference a day makes in the SPX. And it demonstrates the second element of a successful strategy. You can do it on a Tuesday for sure, and maybe even on Wednesday or Thursday. Friday, take the day off.
And never on Monday.
= = =
Read another story by this author:

