

The VIX (Volatility index) is a measure of the level of implied volatility of a wide range of options, based on the S&P 500. In general, it moves higher when the US stock market is heading lower and lower when the US stock market is heading higher.
There is a very well-known and followed VIX pattern that is traded in the professional trading arena. It is known as the VIX US equity buy/sell signal. The trade set up utilizes standard Bollinger Bands®. It is a three-step process and all have to happen in order for the trade set up to trigger.
The Trade Set Up
Bullish US equity buy signal: The VIX must have a daily closing candle outside the Bollinger Band-above. The next daily candle must close back inside the Bollinger Band and the following daily candle must close below the lows of the previous day’s candle. The opposite would have to take place for a VIX equity sell signal, but the same steps.
In the past, this pattern was a very rare and when seen, many made some serious money following it. But over the past two years, we have seen this pattern show up some 16 times. But here is the crazy part, every one of the signals was an equity buy signal. 16 equity buy signals and not a single sell signal!
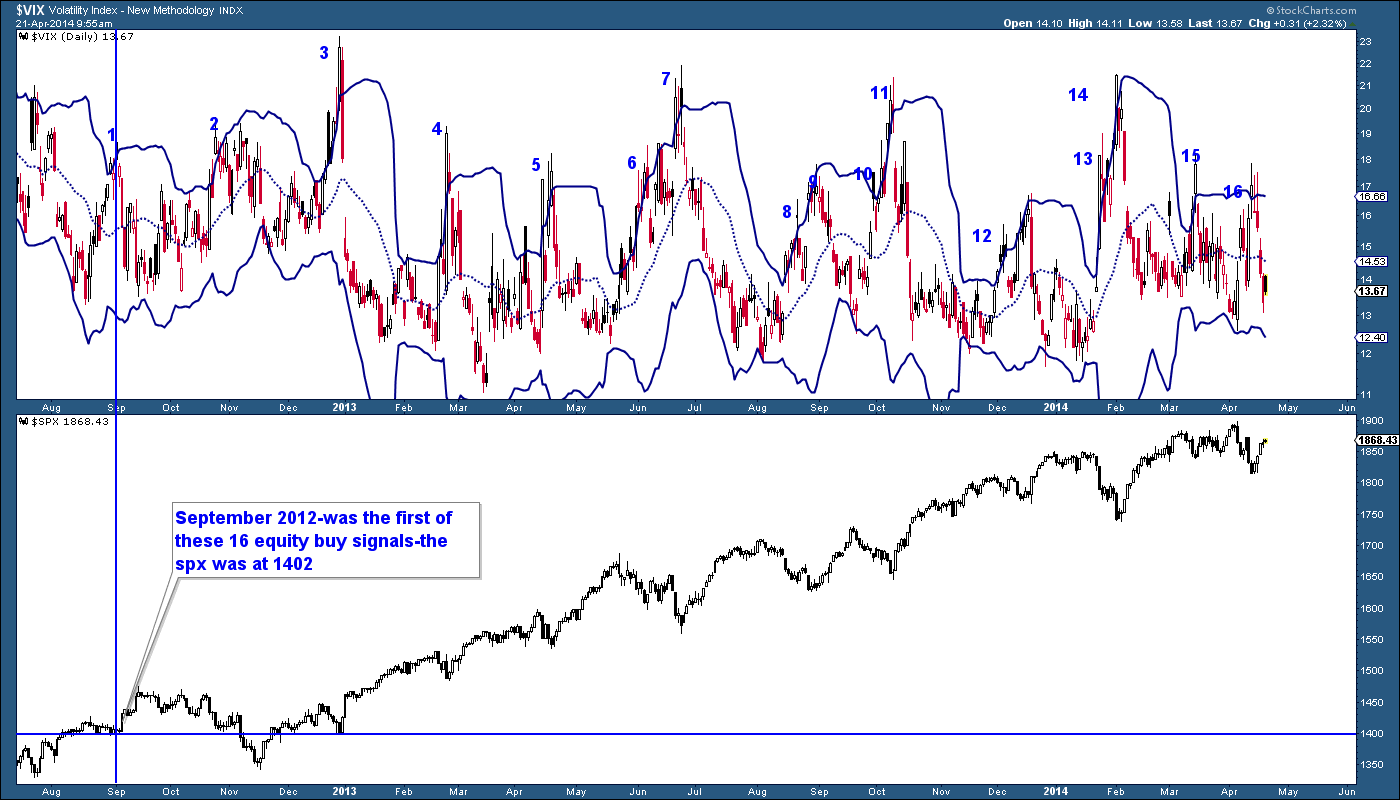
September 2012 was the first of the 16 VIX equity buy signals over the past two years, as the SPX was trading at 1402. The 16th equity buy signal hit on April 11, 2014, when the SPX was trading at 1814. This is what’s leading me to believe that the VIX is broken or at least this reliable trade signal.
The SPX has risen some 495 points from the first equity buy signal and yet we have seen 15 others and not a single sell signal. You have to ask, how can we see 16 buy signals as the SPX has risen that much? Remember, the VIX DROPS when equities rise.

