

Assessing Potential “Big Stock” Leaders in the Age of Instant Information
In the course of operating our investment website we receive a large number of emails from individuals who claim that the investment methodology “invented” and espoused by William J. O’Neil, otherwise known by the acronym CAN SLIM®, has not worked well for them in this environment. To some extent we might agree, since the old ways of buying stocks based on fundamental information that “the crowd” already knows and technical information (e.g., chart “breakouts”) that the crowd all sees at the same time suffer from a particular contrarian handicap. That handicap is simply the idea that if everybody already knows it and everybody sees it all at the same time, what edge does one really have?
Great speculators, like Jesse Livermore, have had an intuitive feel, developed by years of experience, for where money was flowing in the markets. One might make note of the fact that while O’Neil frequently cites Livermore in his work, Livermore never used a “techno-fundamental” template like CAN SLIM®. Livermore relied on his understanding of technical action and an overall feel for the “leading issues of the day,” as he put it, in the market at any given time. Livermore’s “leading issues of the day” concept is the essential source for what we have identified as the “Big Stock Theory” in our books and which we apply in the markets today.
A “big stock” is essentially a stock that quickly attracts the attention of institutional investors given its status as a company serving as a driving force at the leading edge of new, breakthrough developments in the current economic environment. This is expressed as highly innovative new products and services that address a specific set of consumer needs in creative, new, and more effective ways. Over the past year we have witnessed huge upside price moves in a number of stocks of companies doing exactly this while failing to meet the essential “CAN SLIM®” characteristics. We chose four of our favorite examples from a long list of “anti-CAN SLIM®” stocks that have had big moves over the past year.
Our first example is Yelp (YELP), shown in Chart 1, below. YELP is the leader in companies providing an online platform for the compilation of consumer reviews through a membership site. By providing an essential service to consumers that in turn creates a pool of users, YELP also attracts the advertising dollars of businesses looking to reach these consumers. After coming public in early 2012, YELP built a more than year-long consolidation before breaking out and having a three-fold move in price before topping out at around the $100 price level in March of 2014. All the while, YELP continued to post losses as sales growth went through the roof. This is reminiscent of many dot.com stocks in the late 90s that had no earnings yet posted strong sales growth. Companies such as Amazon (AMZN) had no earnings until late 2001 yet its massive increase in price came between 1997-1998 when it experienced a 75-fold increase in value over that short timeframe. In other words, it appreciated more than 7400% in under 2 years.
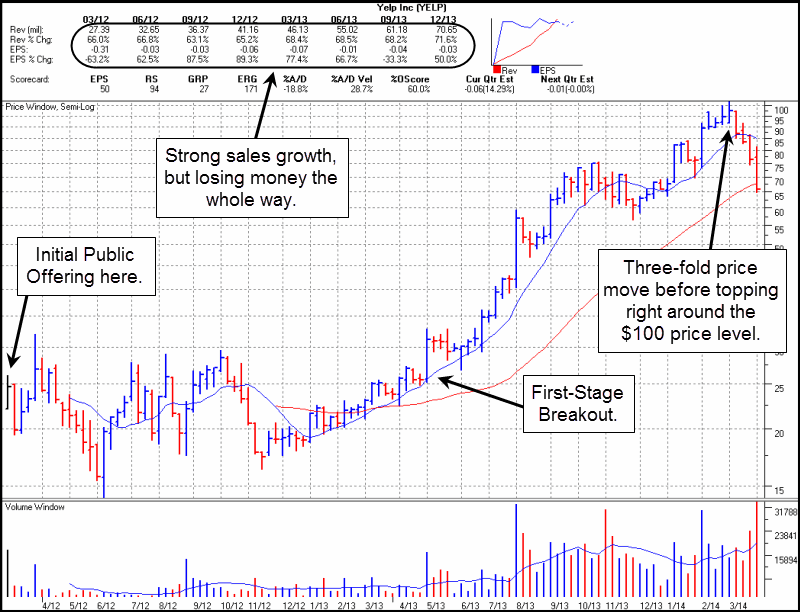
Chart 1 – Yelp (YELP) weekly chart, 2012-2013. Chart courtesy of HGS Investor Software, ©2014 used by permission.
Cloud-computing has been a strong theme in today’s technology economy, and there is no shortage of companies exploiting the “cloud” via their product and service offerings. Workday (WDAY) addressed a special need by providing cloud-based applications for human capital management, payroll, financial management, time tracking, procurement, and employee expense management, essentially bringing the cloud to the human resources field. WDAY came public in October of 2012 and went sideways for the next five months before breaking out and setting off on a price move that saw the stock double before finally topping out at 116.47 in March of 2014. Throughout this move, WDAY kept posting negative earnings-per-share as sales growth grew at robust, high-double-digit rates.
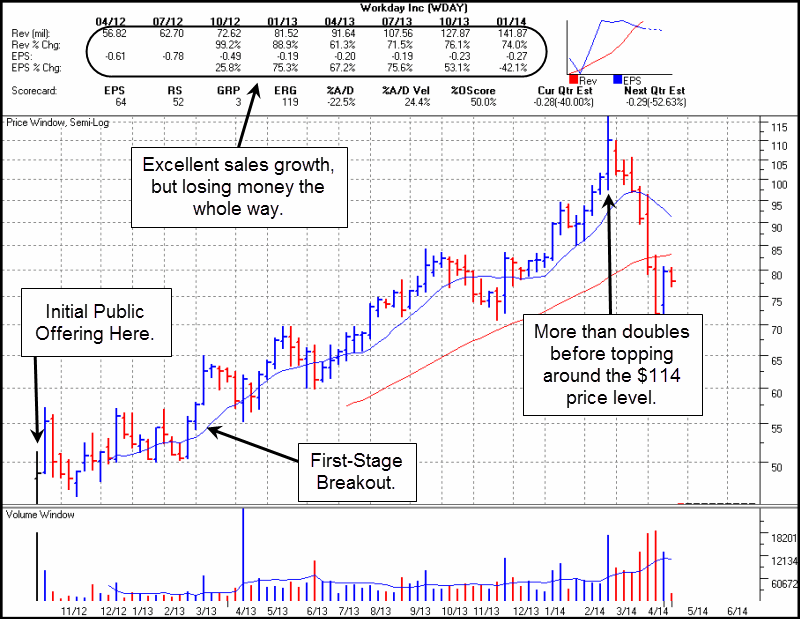
Chart 2 – Workday (WDAY) weekly chart, 2012-2014. Chart courtesy of HGS Investor Software, ©2014 used by permission.
Admittedly our favorite example, Tesla Motors (TSLA) was the first electric car company to demonstrate that style and performance could provide an attractive alternative to consumers otherwise turned off by electric cars that had previously been designed as strictly utilitarian vehicles. TSLA also expanded this role as a ground-breaking electric car innovator by addressing the infrastructure issue inherent in these types of vehicles, namely, where and how do you charge these things? TSLA came up with the innovative idea of creating “Supercharger” stations where Tesla car owners could pull in and quickly charge their cars for free for the life of the car. By placing these stations as strategic locations around the country, Tesla gave their customers a means to stay charged up even as they drove across the country. Tesla came public in July of 2010 with losses aplenty and $18.6 million in sales growth for the December 2009 quarter. The stock went sideways for about two years before gapping up out of a “first-stage” base in April of 2013, and was just barely starting to turn a profit with the December 2012 becoming the last quarter in which the company would post a loss. But Tesla did not wait around for several quarters of 20% earnings growth or better. It began a sharp move to the upside that took the share price from around $40 to over $100 in a short seven weeks. That was the sharpest upside thrust in the stock’s chart as of the time of this writing in April 2014, and it occurred while the stock was barely starting to show a profit, but sales growth was coming in a 677%. Eventually, Tesla peaked out around 265 in March of 2014, making for a 640% move from that initial breakout in April of 2013.
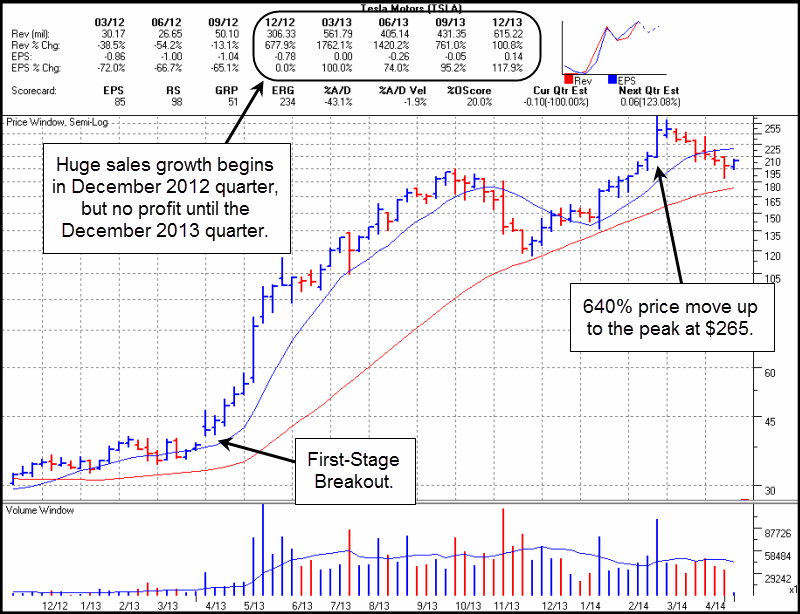
Chart 3 – Tesla Motors (TSLA) weekly chat 2012-2013. Chart courtesy of HGS Investor Software, ©2014 used by permission.
Basking in light of Tesla’s halo, another company founded by Tesla CEO Elon Musk, SolarCity (SCTY), also had a huge price move during the same time period as Tesla and all while (you guessed it) posting big losses of as much as 36 cents a share. But what SCTY had going for it was the fact that it was intimately involved in one of Tesla’s biggest innovations providing the solar panels for the Supercharger stations Tesla was building to provide free charge-ups-for-life to their car customers. This, and the fact that the solar energy stocks were confirming an overriding group strength at the time, was enough to pique the interest of mutual funds, hedge funds and other institutional investors who bought the stock in size. SCTY had two breakouts from two separate flag formations within several weeks of its December 2012 Initial Public Offering below the $20 price level that resulted in a four-fold price move to a peak of 88.35 in February 2014.
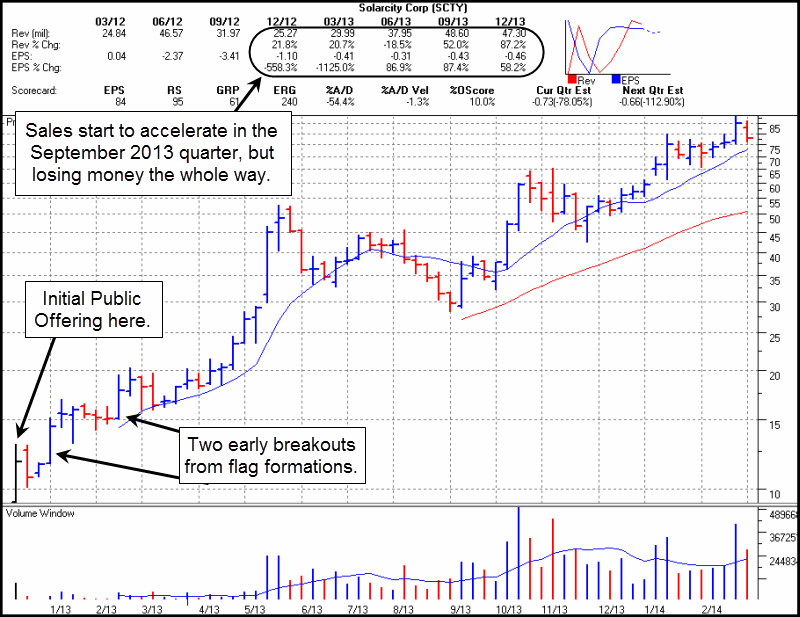
Chart 4- SolarCity (SCTY) weekly chart 2013-2014. Chart courtesy of HGS Investor Software, ©2014 used by permission.
Our studies of such “anti-CAN SLIM®” winning stocks shows that they too had some special but very specific characteristics. The first was a compelling thematic concept driving their business. Yelp’s “big stock” theme was first-move advantage as a provider of consumer review sites that in turn sold access to their user base via advertising for businesses. Workday brought the cloud to a previously ignored but essential function of any business: human resources. Tesla built a better mouse-trap by re-thinking the electric car concept and addressing the infrastructure issues specific to electric cars. SCTY enjoyed the “halo effect” of its association with Tesla as the provider of solar panels for Tesla’s Supercharge sites.
In addition, each of these companies was showing at least a couple of quarters of huge sales growth indicative of expanding market share. New technologies that address new markets are hard to get a handle on in terms of their potential size, and companies that are demonstrating the ability to take market share in a potentially large pool of business tend to be strong stock performers as well. The fact that each of these stocks was a very recent IPO also helped to flag them as nascent innovators.
Probably the most critical component present in each of these stocks was strong institutional interest. All four of these examples showed strong institutional ownership in the early stages of their post-IPO existence, with anywhere from 76 to 300 or more mutual funds having a position in the stock at the time of their big price runs. In a sense this is a critical component in a world where what everyone knows with respect to past earnings and sales growth one must seek an advantage by getting out ahead of the crowd and doing a little forward thinking. In this manner one can indirectly make use of the research departments of institutional investors who have done their due diligence and who are voting with their investment dollars.
So is “CAN SLIM®” really dead? We don’t think so. We tend to view what is going on today as merely the logical evolution of the methodology as stock fundamental and technical information becomes instantly available to everyone at once. I remember back in the early 1990’s when I was a broker at Merrill Lynch and had a subscription to the green NASDAQ and blue NYSE chart books sold by William O’Neil + Co., Inc. as Daily Graphs® back then. Having the data in these books available at my fingertips provided me with information that other brokers and my clients, for the most part, did not have. I had an information advantage. Today, that advantage has dissipated, as the internet has changed the ballgame in a meaningful way. Everybody knows everything and all at once. In light of this, understanding that one must employ a more forward-thinking approach to stock selection as the markets evolve is a critical component for investment success, and we believe it can be achieved in a concrete manner.
Gil Morales and Dr. Chris Kacher are both principals and managing directors of MoKa Investors LLC and Virtue of Selfish Investing, LLC, cofounders of www.selfishinvesting.com and co-authors of “Trade Like An O’Neil Disciple: How We Made 18,000% in the Stock Market” (Wiley, August, 2010) and their newest book, “In the Trading Cockpit with the O’Neil Disciples,” (Wiley, December 2012). Both are former internal portfolio managers for William O’Neil + Co., Inc., where Dr. Kacher also served as a senior research analyst and co-authored an in-house proprietary book “The Model Book of Greatest Stock Market Winners”, while Mr. Morales also served as Chief Market Strategist, Vice-President and Manager of the firm’s Institutional Services group, and co-authored with William J. O’Neil a book on short-selling, “How to Make Money Selling Stocks Short” (Wiley, 2004).They are currently working on their third book, tentatively titled, “Turn to the Dark Side with the O’Neil Disciples: A Treatise on Short-Selling and the New Wave of Contra-O’Neil Techniques.
RELATED READING
Read another story by Morales and Kacher
Short Selling For Dummies: Build A Watch List

