

The month of May can be a feast or famine period in the equity markets, but one thing is for sure it is known for volatility. For instance, from 1965 through 1984 the S&P 500 was down 15 out of 20 Mays; yet from 1985 through 1997 May was the best month with 13 consecutive gains. The recent multi-month consolidation pattern sets the stage for an exciting summer in the financial markets.
It is important to note that May begins what the “Stock Trader’s Almanac” identifies as the worst six months of the year. To illustrate the point, the almanac claims that a $10,000 investment compounded to $765,055 from November through April in the previous 63 years, but when considering the May through October time frame, a $10,000 investment would have netted a loss of $1,105. Clearly, this is the time of year investors, and traders alike, should begin to focus on the possibility of a correction.
In our view, the door is wide open for something rather substantial. After all, the major stock indices are approaching the seasonally bearish time of year near all-time-high prices. Similarly, technical oscillators on long term charts are screaming overbought.
Another factor working against the rally is the fact that since 1950, Mays have ranked poorly; specifically, the Dow ranked 11th and the S&P was 9th out of 12 months. We aren’t suggesting that traders bet the farm on shorts, or investors go to 100% cash, but in our opinion, market participants should be highly aware of the potential of dramatic corrective action and prepare accordingly.
We’ve all heard the adage, “Sell in May and Go Away”. And based on the previously provided stats it is clear there is some validity to the theory. However, the month of May consists of 31 days leaving a relatively wide window of opportunity and plenty of room for poor timing. Particularly, those getting aggressively bearish early in the month might regret it. Statistics suggest the broad market closes higher approximately 70% of the time on the first two trading sessions of the May. Thus, even if the theory of turning bearish in May comes full circle, timing will be imperative.
For help with timing, we look to the chart of the S&P 500 futures contract in multiple time frames. Both the monthly and weekly charts depict a market that is quickly approaching technical resistance in the form of the upper lip of an up-trend channel. Although prices may break out of such a channel at any time, it is a relatively rare occasion in an environment in which values are already over-extended. According to mathematical oscillators, the S&P is rally is certainly over-reaching. In fact, the RSI (Relative Strength Index) produced by the monthly chart is in excess of 70 for only the third time since the late 1990s. In previous occasions (2000 and 2007), the miraculous stock market rally came to a dramatic end. We aren’t suggesting that we’ll get a repeat of the aforementioned bear markets, but in our opinion, there is a real possibility of a violent re-pricing. The weekly chart suggested a trip to the low 1700s is overdue, but if those that have been complacently buying into the rally get nervous, the low 1600s to high 1580s aren’t out of the question. Don’t forget, markets have a tendency to take the escalator up but they take an elevator down. Nonetheless, before prices roll over the odds favor another new high. Look for resistance near 1908ish as a place to begin turning bearish.
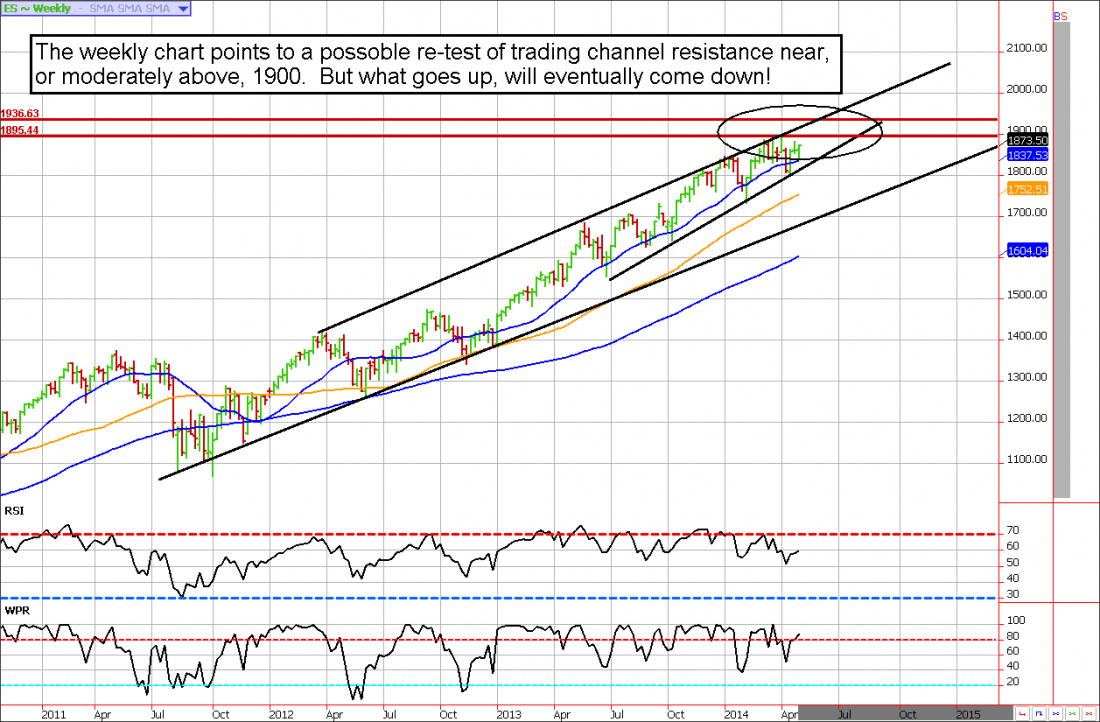
The weekly chart
Obviously, there are no guarantees the S&P 500 will succumb to the technical headwinds as we suspect. Also, even if it does…it could take months for this pattern to play out. Thus, if you want to be a bear in anticipation of “sell in May and go away” trade, don’t expect making money to be as simple as selling the market and walking away. Look for rallies into resistance before executing trades, this provides higher probability and less stressful entries. Bears chasing prices lower has been a painful endeavor in recent years. It isn’t enough to be right in direction, you must be right in timing too!
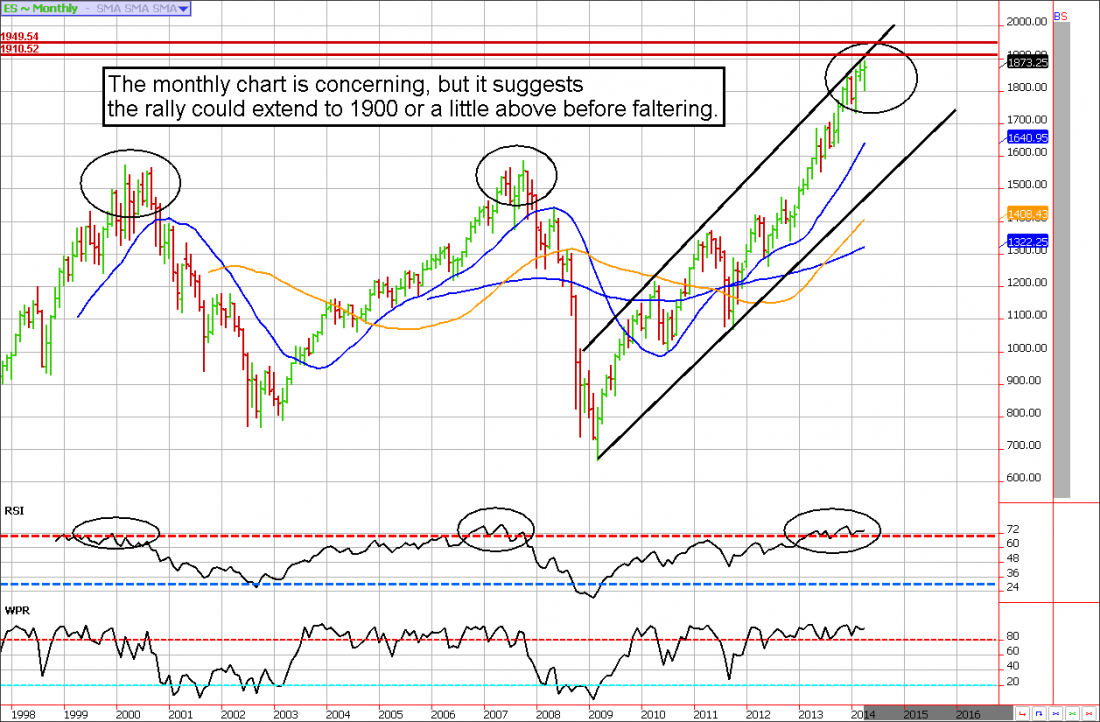
The monthly chart
*There is substantial risk in trading options and futures. It is not suitable for everyone.
= = =
Carley Garner is the Senior Strategist for DeCarley Trading, a division of Zaner, where she also works as a broker. She authors widely distributed e-newsletters; for your free subscription visit www.DeCarleyTrading.com. Her books, “A Trader’s First Book on Commodities,” “Currency Trading in the FOREX and Futures Markets,” and “Commodity Options,” were published by FT Press.
RELATED READING
Read another story by this author.

