

The U.S. equity markets have been in a consolidation pattern for most of 2014. It is breaking out of that range to the upside and I am expecting to see all of the financial newsletters that have been kind bearish, turn all out bullish now.
It has been typical for the indexes to do just this —have everyone not believing in the current move until it is about to reverse. There is a massive bearish rising wedge pattern forming on the SPX (S&P 500 index) If this pattern plays out to its full potential, it would give us a target all the way down to the 1800-1790 area.
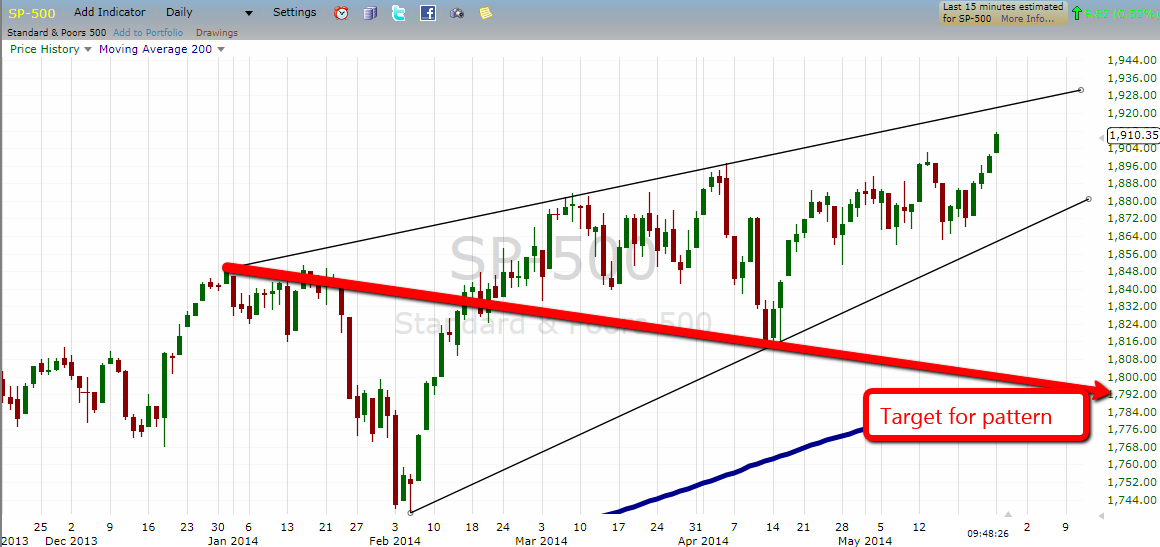
There is still room for the SPX to move higher and the 1915-1928 area is where I will be watching. Now there is no guarantee this pattern will play out fully, but it is something you want to watch.
We have identified a turn date on May 28, which could overshoot into June 1, being the end of month window dressing. But there is another reason you have to be a little careful here. And that is the equity sell signal about to be generated on the VIX.
It is something we have not seen too often. We have only seen two equity sell signal in the last 2 ½ years. During that time, we have seen the SPX rise some 650 points. Remember, the VIX moves down as the SPX moves higher. So seeing only two equity sell signals during that 650 point rise, is a very rare occurrence and must be taken seriously is triggered.
= = =
To learn more about the equity buy/sell signals generated by the VIX and what the SPX did after these signals were triggered, click here for the full report and charts.

